Neural Network Hypothesis and Intuition
Explore the hypothesis and intuition behind neural networks, including their structure, activation functions, and how they process inputs to produce outputs.
Neural Networks Overview
The Feature Explosion Problem
Why do we need Neural Networks?
Suppose we have as input features and we want to compute a hypothesis .
We can
For quadratic features
- Quadratic terms grow roughly as
so we will end up with 5000 additional features if we have 100 features.
For cubic features
-
Cubic terms grows as
-
So we will end up with 166,000 additional features if we have 100 features.
As the features become more complex, the number of parameters grows rapidly.
It becomes
- computationally expensive to compute the hypothesis with many features.
- Memory-Heavy to store all the parameters.
- Prone to overfitting due to the large number of parameters.
In this case, we can use a neural network to compute the hypothesis more efficiently.
Practical Example: Image Recognition
Suppose we have a 100 × 100 pixel image as input.
- Each pixel is a feature, so we have
10,000features. - For RGB images, we have 3 color channels, so we have
30,000features.
If we want to compute a hypothesis with quadratic features, we would have on the order of 450 million features, which
is computationally infeasible.
Conclusion
Polynomial logistic regression: Works for small
- Explodes combinatorially for large
- Computationally impossible for large feature sets (like images)
- We need a non-linear model that can capture complex relationships without explicitly generating all polynomial features.
Neural Networks as a Solution
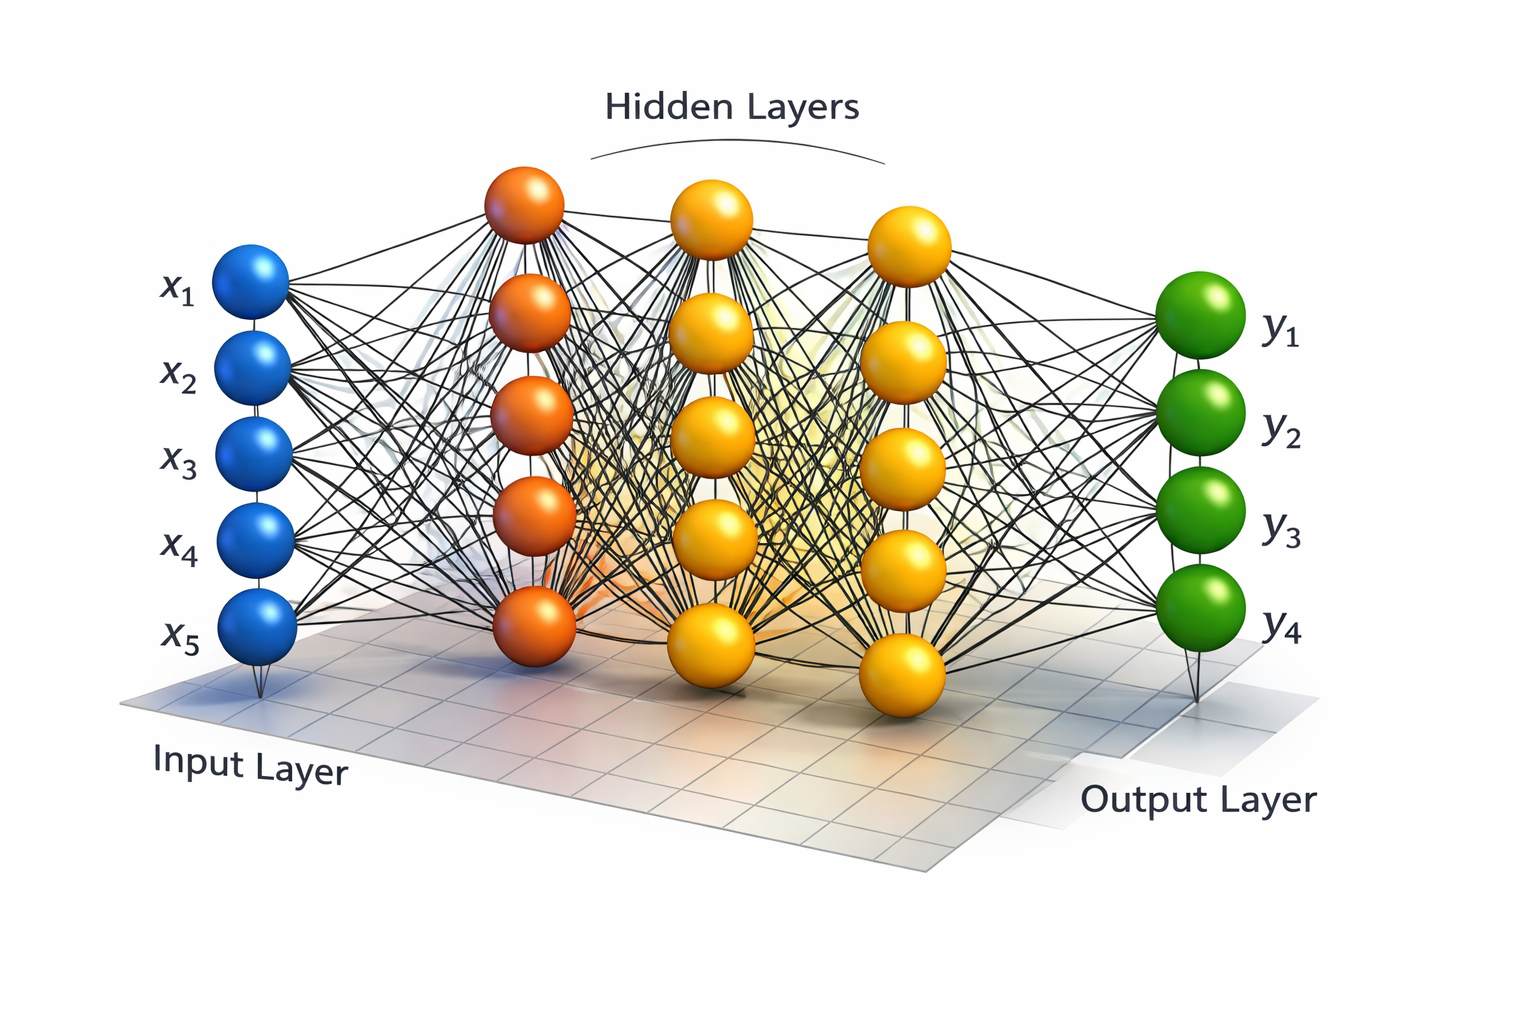
Neural networks can compute complex hypotheses without explicitly generating all polynomial features.
NN Types and Applications
Comparison of Neural Network Types
| Network Type | Best For | Memory | Spatial Awareness |
|---|---|---|---|
| Feedforward | Tabular data | No | No |
| CNN | Images | No | Yes |
| RNN | Sequences | Yes | Limited |
Evolution of Architectures
Today, many RNN tasks are increasingly replaced by:
- Transformers
- Attention mechanisms
flowchart LR

    A[Feedforward Networks]

    A --> B[CNNs]

    A --> C[RNNs]

    C --> D[LSTM / GRU]

    D --> E[Transformers]
1. 🔀 Standard Feedforward Networks
Information moves only in one direction:
Also called:
- Fully Connected Networks
- Dense Neural Networks
- Multi-Layer Perceptrons (MLP)
No cycles or memory.
flowchart LR

    A1[Input 1]
    A2[Input 2]
    A3[Input 3]

    A1 --> H1
    A1 --> H2

    A2 --> H1
    A2 --> H2

    A3 --> H1
    A3 --> H2

    H1[Hidden Layer]
    H2[Hidden Layer]

    H1 --> O[Output]
    H2 --> O
Often used for:
- Housing price prediction
- Online advertising
- Credit scoring
- Customer churn prediction
- Fraud detection
Mathematical Representation
For one layer:
Where:
- = input vector
- = weights
- = bias
- = activation function
2. 🏞️ Convolutional Neural Networks (CNNs)
CNNs are specialized neural networks designed primarily used for
image data
- Exploit spatial structure in images
Instead of connecting every neuron to every pixel to CNNs detect patterns using
- convolution filters
- feature maps
flowchart TD

    A[Input Image]

    A --> B[Convolution Layer]

    B --> C[Feature Maps]

    C --> D[Pooling Layer]

    D --> E[Fully Connected Layer]

    E --> F[Prediction]
Mathematical Representation of Convolution
A filter slides across the image.
Where:
- = image
- = kernel/filter
- = kernel/filter
flowchart LR

    A[Image]

    A --> B[Edges]

    B --> C[Textures]

    C --> D[Shapes]

    D --> E[Objects]
Use Case
- Image classification
- Face recognition
- Medical imaging
- Self-driving cars
- Object detection
3. 🔢 Recurrent Neural Networks (RNNs)
RNNs process data step-by-step while remembering previous information.
- Unlike feedforward networks, RNNs have memory.
- They can capture temporal dependencies in data.
Used for sequence data
Examples:
- Audio (time series)
- Language (word-by-word sequence)
RNN Architecture
flowchart LR

    X1[Word 1] --> H1
    H1 --> H2

    X2[Word 2] --> H2
    H2 --> H3

    X3[Word 3] --> H3

    H1[Hidden State]
    H2[Hidden State]
    H3[Hidden State]
Mathematical Representation of RNNs
Where:
- = current input
- = previous hidden state
- = updated memory state
Use Cases for RNNs
Audio / Time Series
- Speech recognition
- Sensor data
- Financial forecasting
Language Processing
- Translation
- Chatbots
- Text generation
- Next
4. Custom Neural Networks
Tailored for specific applications Used in complex systems like autonomous driving:
- CNNs for images
- Other components for radar
- Combined into custom architectures
Neurons as Computational Units
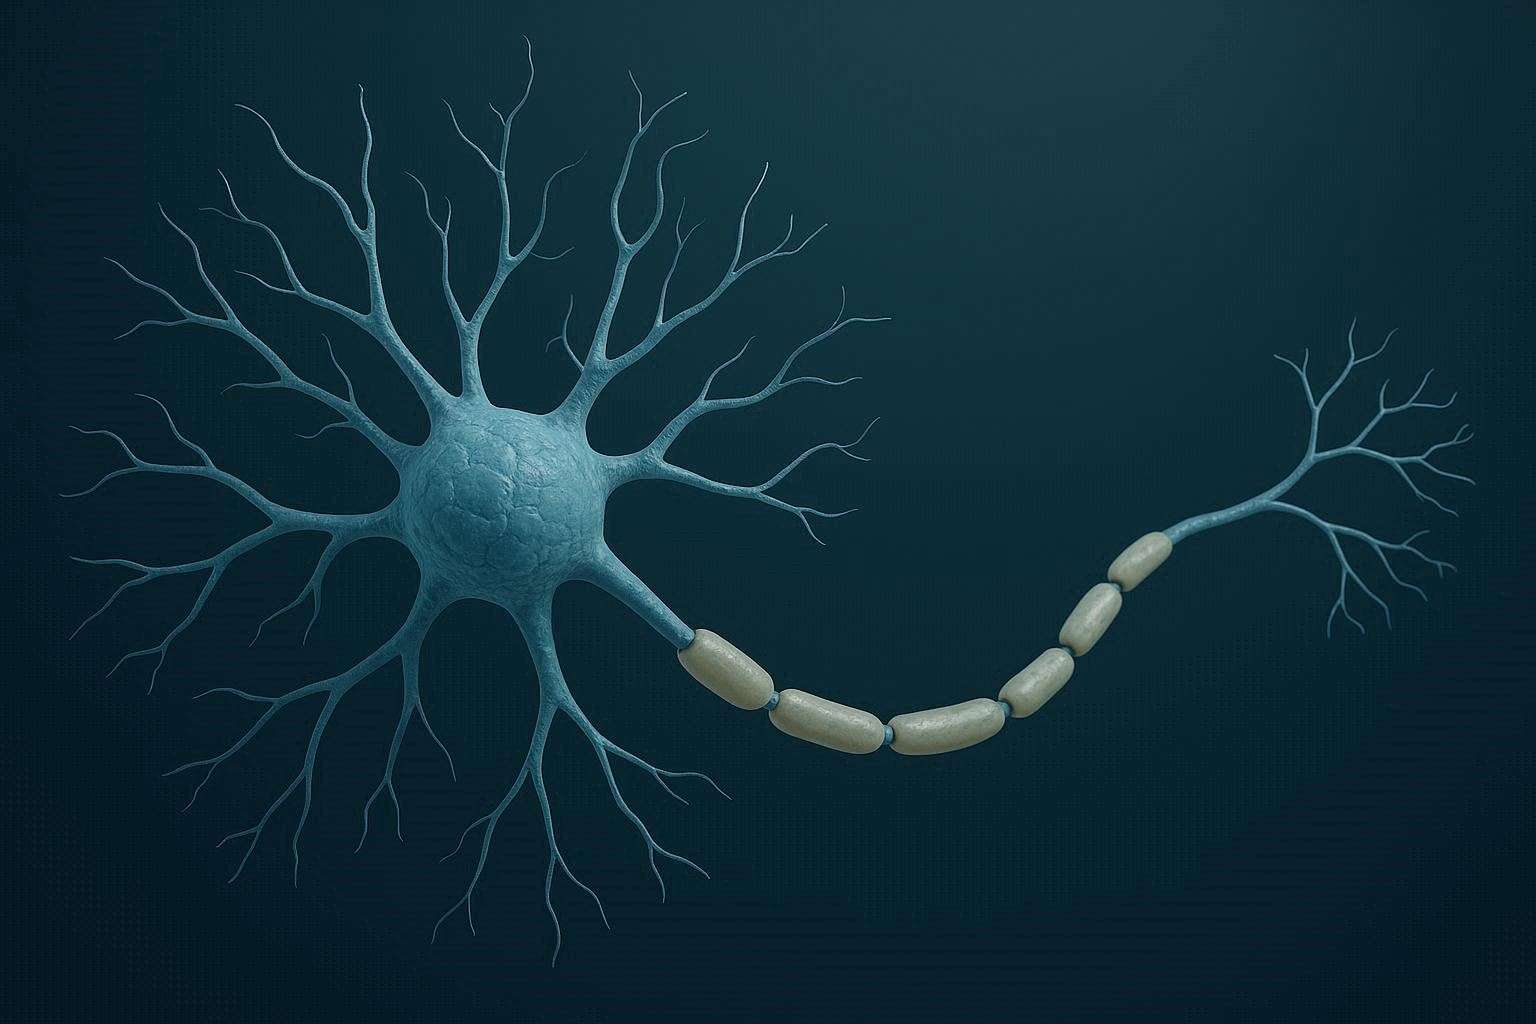
At a simple level, neurons are computational units.
They:
- dendrites(head): Take inputs
- Process them: apply weights and activation function
- axon(tail): Produce an output
Artificial Neurons Model: Logistic Unit
In artificial neural networks, we model neurons as mathematical Logistic functions.
graph LR

subgraph Input Layer
x0(((x0)))
x1(((x1)))
x2(((x2)))
x3(((x3)))
end

subgraph Activation Layer
a1{a1}
end

x0-->a1
x1-->a1
x2-->a1
x3-->a1


subgraph Output Layer
y(((hθx)))
end

a1-->y
A simple network looks like:
In our machine learning model:
Inputs are features:
Parameters are called weights
Bias unit
is the bias unit/ bias Neuron and it is always equal to 1
- For simplicity we dont draw
Output
Outputs of neurons are called activations Weights which is the hypothesis
where
And we can rewrite:
so the hypothesis can be expressed as:
is the activation function that introduces non-linearity into the model.
Activation Function
is the activation function. for Hypothesis function:
- Example:
ReLU,sigmoid,tanh, etc.
Neural networks using sigmoid activation function for logistic regression:
Where
Where
ReLU vs Sigmoid Activation Function
Sigmoid
Input:  -5    0    5
Output: 0.01 0.5 0.99
Outputs behave like probabilities.
Sigmoid squashes outputs between:
0 and 1
Its derivative becomes very small for large positive or negative values.
Vanishing gradient
Deep neural networks may contain:
- dozens
- hundreds
- thousands
of layers.
During backpropagation:
- gradients are multiplied repeatedly across layers.
If gradients are small:
0.1 × 0.1 × 0.1 × 0.1 ...
they rapidly approach zero.
Example
Suppose gradient values are:
0.2 × 0.2 × 0.2 × 0.2 × 0.2
Result:
0.00032
Very tiny gradients mean:
- almost no weight updates
- slow or stalled learning
Exploding vs Vanishing Gradients
| Problem | What Happens |
|---|---|
| Vanishing gradients | Gradients become too small |
| Exploding gradients | Gradients become too large |
Rectified linear unit ReLU
ReLU activates only positive values. Negative values become zero.
Input:  -3  -1   0   2   5
Output:  0   0   0   2   5
ReLU helps because:
- gradients remain stronger
- training becomes faster
- deep networks scale better
Enables: This enables:
- deeper networks
- faster convergence
- stable learning
Which was not possible with sigmoid before
| Feature | ReLU (Rectified Linear Unit) | Sigmoid |
|---|---|---|
| How it works | If the signal is positive, it passes it forward; if negative, it outputs zero | Converts output into a probability between 0 and 1 |
| Example (Cat model) | Strong whisker detection → output 3.5 (feature exists strongly) |
Final output → 0.92 → “92% chance this is a cat” |
| Output Range | [0, ∞) |
[0, 1] |
| Best suited for | Hidden layers; very fast and helps deep models learn efficiently | Output layer for yes/no classification problems |
| Performance | Computationally efficient | Comparatively slower |
| Formula | f(x) = max(0, x) |
f(x) = 1 / (1 + e^(-x)) |
| Optimized for | Avoiding vanishing gradients | Predicting probabilities |
Neural Network Structure
An Artificial Neural Network is a computational graph with layers of artificial neurons.
Neural networks are simply multiple logistic regression units stacked together.
Each layer:
- Takes activations from previous layer
- Multiplies by weight matrix
- Applies sigmoid activation
- Passes result forward
graph LR
    Input --> Hidden-Layer
    Hidden-Layer --> Output
1. Layer 1: Input layer
Takes features as Input
- = 1 is bias unit that is not drawn
2. Layer 2: Hidden layer:
All Intermediate Layers between Input & Output Layer
- Computes intermediate activations
- =1 is bias unit that is not drawn
= Activation output of th neuron in layer
- = Neuron Index inside that layer
- = layer number
Example:
- = first neuron in Second hidden layer
- = 3rd Neuron in Second hidden layer
Computing Hidden Layer Activations
Activation can be computed as :
Where g(.) is sigmoid
Weight Matrices
Weight Matrix of layer
- weight matrix maps layer to layer
- Each th layer gets its own matrix of weights
- Layers are indexed starting from 1, not 0.
Weight Matrix Dimensions
Outputlayer Neurons x (InputLayer Neurons + 1) Dimensioned Matrix
- Input side includes bias
- Output side does NOT include bias
would be a Matrix of dimension:
Where:
- = number of
neurons/unitsin th layer - units in Output layer
Practical Example:
Each Input Layer is densely connected to each Activation Function of next Layer:
- Input layer: 3 units + 1 Bias
- Hidden layer 1: 4 units + 1 Bias
- Output layer: 1 unit
graph LR
    %% ===== Layer 1 =====
    subgraph "Layer 1: Input Layer"
        x0((x0 = 1))
        x1(((x1)))
        x2(((x2)))
        x3(((x3)))
    end

    %% ===== Layer 2 =====
    subgraph "Layer 2: Hidden Layer"
        a0{a0 = 1}
        a1{a1}
        a2{a2}
        a3{a3}
        a4{a4}
    end

    %% ===== Layer 3 =====
    subgraph "Layer 3: Output Layer"
        y(((hθx)))
    end


    %% Input → Hidden
    x0 --> a1
    x0 --> a2
    x0 --> a3
    x0 --> a4

    x1 --> a1
    x1 --> a2
    x1 --> a3
    x1 --> a4

    x2 --> a1
    x2 --> a2
    x2 --> a3
    x2 --> a4

    x3 --> a1
    x3 --> a2
    x3 --> a3
    x3 --> a4


%% Hidden → Output
    a0 --> y
    a1 --> y
    a2 --> y
    a3 --> y
    a4 --> y
Simplified
Showing Bias unit but only 1 connection for reference
graph LR
    x0(((x0))) --> a1{a1}
    x1(((x1))) --> a1{a1}
    x1 --> a2{a2}
    x1 --> a3{a3}
    x1 --> a4{a4}

    x2(((x2))) --> a1
    x2 --> a2
    x2 --> a3
    x2 --> a4

    x3(((x3))) --> a1
    x3 --> a2
    x3 --> a3
    x3 --> a4

    a0{a0} --> y(((hθx)))
    a1 --> y
    a2 --> y
    a3 --> y
    a4 --> y
Given
- Input layer:
- Hidden layer:
- Output layer:
Where:
- → bias unit for the input layer
- → bias unit for the hidden layer
Weight Matrix:
Layer 1 ()
Input Layer → Hidden Layer
=> 4 (a_1, a_2, a_3, a_4) × 4
Layer 2 ()
Hidden Layer → Output Layer
=> 1 (output neuron) × 5
Activation of Neurons in Layer 2
First Neuron in layer 2
Second Neuron in layer 2
Third Neuron in layer 2
Where
- : sigmoid activation function of collective term
3. Output layer
Gives us the final hypothesis
- Hidden layer outputs become inputs to the next layer
- Another weight matrix is applied
- Then the sigmoid function is applied again
Output Layer Hypothesis
The final hypothesis is the first neuron of 3rd layer
Which is equals to
Where
- : Sigmoid of final term
- is weight Matrix for final Output Layer
🔢 Normalization Techniques
Normalization techniques are used to stabilize and accelerate the training of neural networks by normalizing the activations of layers. stabilize training
It helps:
- stabilize training
- speed up convergence
- reduce sensitivity to initialization
- prevent activations from becoming too large or too small
1. Batch Normalization (BatchNorm)
Batch Normalization is a technique that normalizes the activations of a layer across the batch dimension during training.
- Introduced in 2015 and widely used in CNNs.
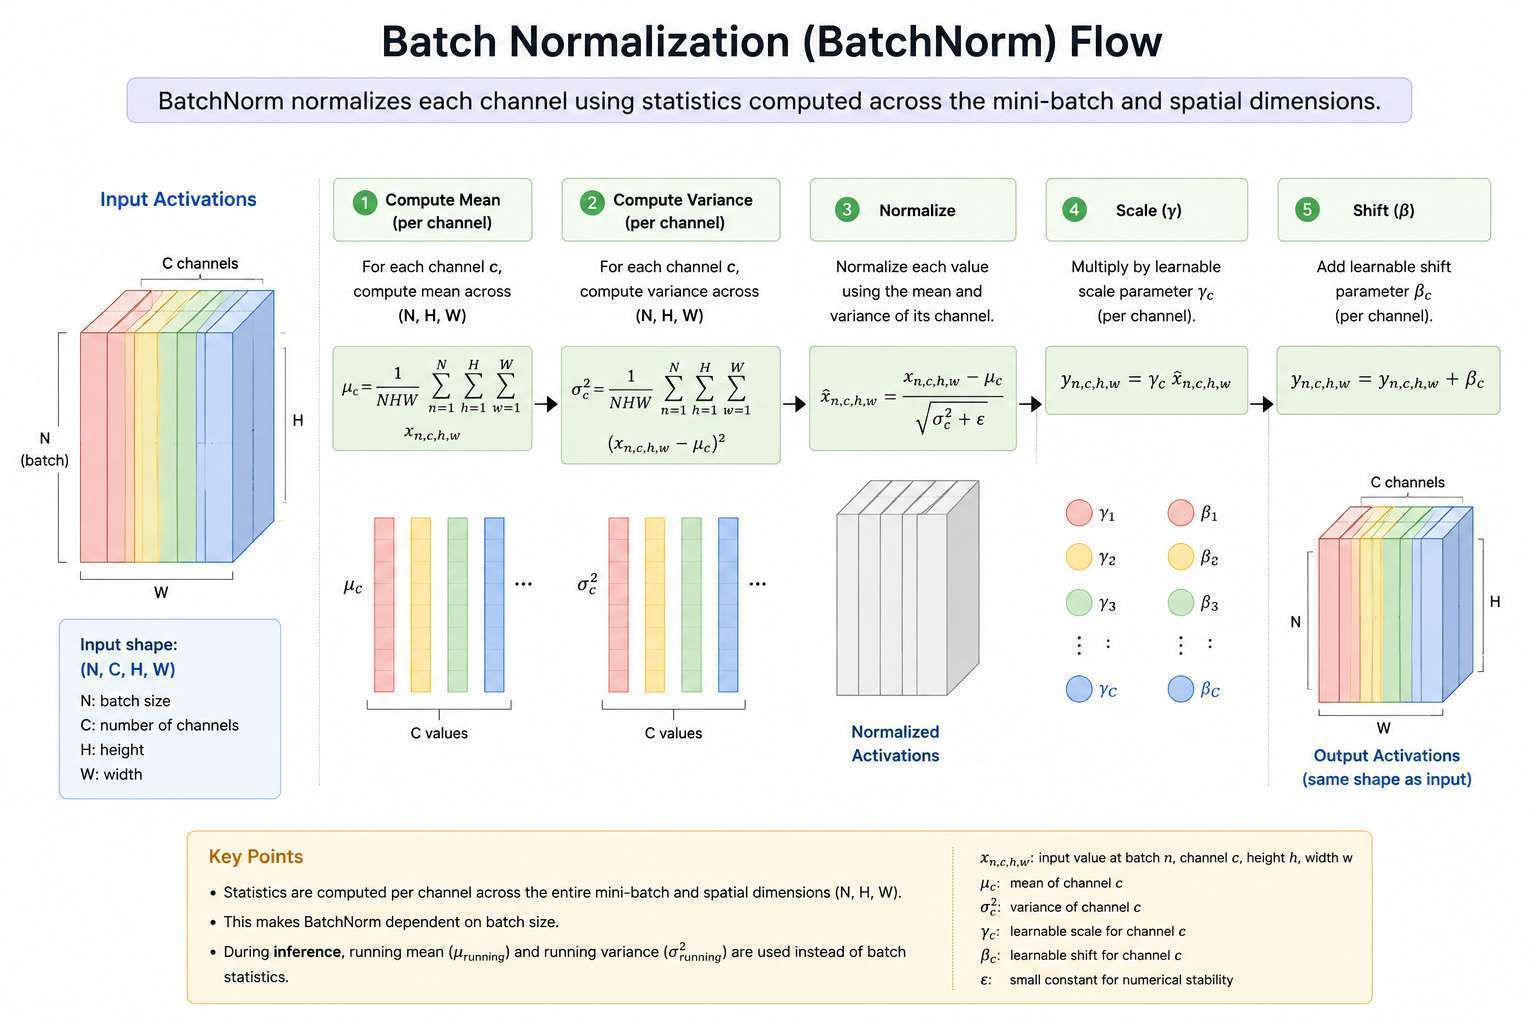
- BatchNorm → normalize across examples in a batch.
Intuition
"Let's compare each kid to the average height of the whole class."
  Entire Class
  ┌─────────────┐
  │ Alice       │
  │ Bob         │
  │ Chris       │
  │ ...         │
  └─────────────┘
          ↓
  Find class average
          ↓
  Adjust everyone
Illustration of BatchNorm process:
Statistics
For CNN input:
BatchNorm computes mean and variance for each channel across:
Where:
- = batch size
- = number of channels
- = height
- = width
flowchart TD

    A["Batch of Images 🖼️🖼️🖼️"]
    A --> B["Compute Mean and Variance ✨"]
    B --> C["Normalize Activations 🔢"]
    C --> D["Scale and Shift 🔣"]
    D --> E["Next Layer"]
Formula
Given activations :
Mean:
Variance:
Normalize:
Scale and shift:
- and are learnable parameters that allow the model to restore the original distribution if needed.
- is a small constant to prevent division by zero.
- denotes the batch of examples.
- is the number of examples in the batch.
- is the activation of the -th example in the batch.
Advantages
- Work Best when we have large batches
- Works extremely well for CNNs
- Faster convergence
- Regularization effect
Limitations
- Depends on batch size: Small batches reduce effectiveness
- Requires synchronization in distributed training
Typical Use Cases
ResNetVGG-EfficientNet- Most
traditional CNNs
2. Layer Normalization (LayerNorm)
Layer Normalization normalizes across the features of a single sample, making it independent of batch size.
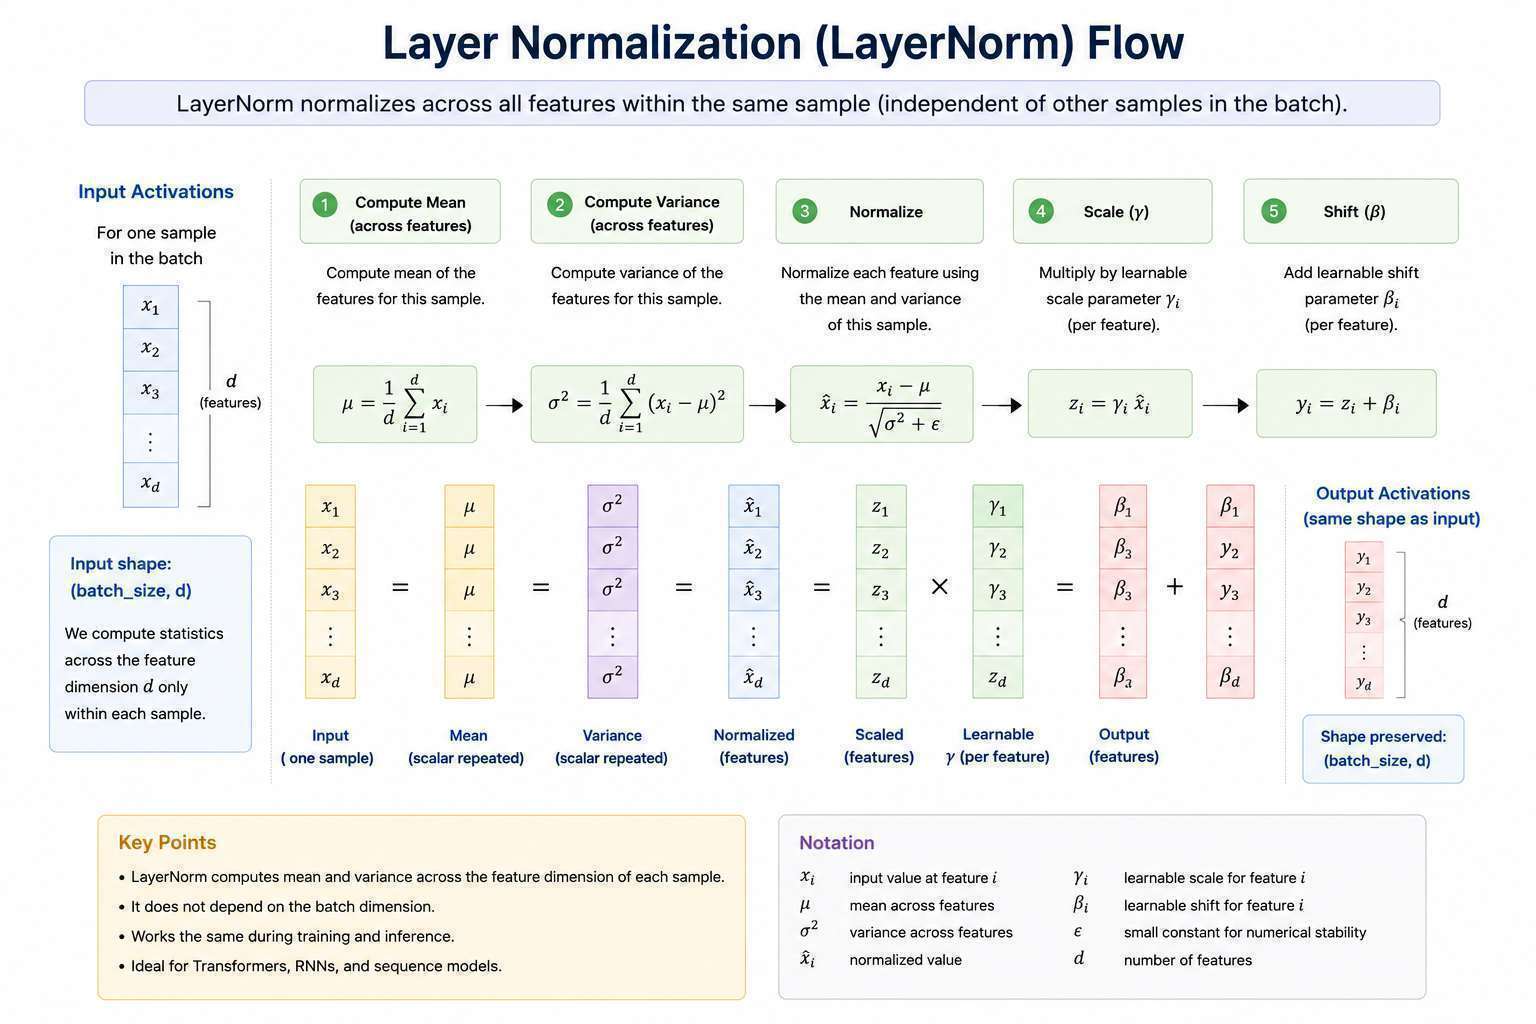
- LayerNorm → normalize across features
Popularized by Transformers.
- Transformers / LLMs → LayerNorm (or RMSNorm)
- RNNs / Sequence Models → LayerNorm
Intuition
"Let's compare your subjects with each other."
    Your Report Card

    Math       90
    Science    70
    English    80
    Art        60
          ↓
    Find YOUR average
          ↓
    Balance YOUR scores
Illustration of LayerNorm process:
flowchart TD

    A[Single Sample 🧩]
    A --> B[Compute Mean and Variance across Features ✨]
    B --> C[Normalize Activations 🔢]
    C --> D[Scale and Shift 🔣]
    D --> E[Next Layer]
Formula
For a hidden vector of size :
Normalize:
Scale and shift:
Statistics Computed Across
For one sample we have features:
Mean and variance are computed across all features: for that single sample.
No dependency on other samples in the batch.
Advantages
- Works with batch size 1
- Stable for sequence models
- Same behavior during training and inference
- Ideal for Transformers
Limitations
- Usually weaker than BatchNorm for CNNs
Typical Use Cases
GPTBERTLlamaRNNsTransformers
3. Group Normalization (GroupNorm)
Group Normalization divides channels into groups and normalizes within each group.
GroupNorm → normalize across groups of channels
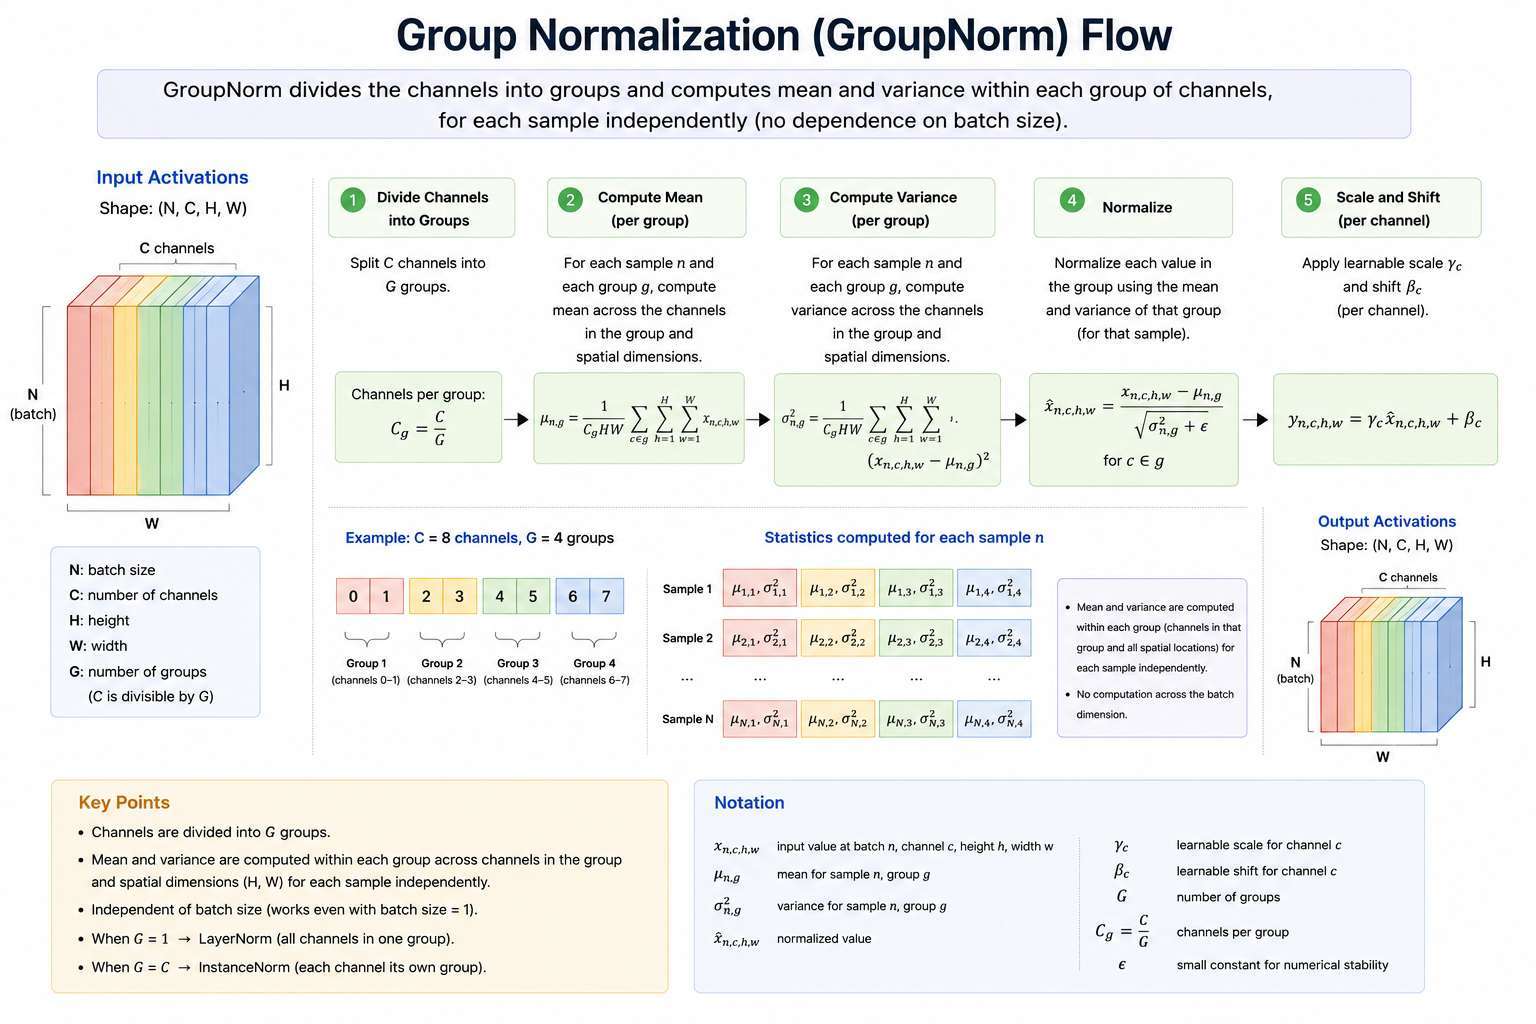
- Designed to remove dependence on batch size.
- Small-batch CNNs → GroupNorm
Intuition
"Let's compare your subjects in groups."
    Whole Class

    ┌─ Red Team ─┐
    │ Alice      │
    │ Bob        │
    │ Chris      │
    └────────────┘

    ┌─ Blue Team ─┐
    │ Emma        │
    │ John        │
    │ Lisa        │
    └────────────┘

    Each team
    finds its own average
Illustration of GroupNorm process:
flowchart TD

    A["Channels 📊"]
    A --> B["Divide into Groups 🧩"]
    B --> C["Compute Mean and Variance within Each Group ✨"]
    C --> D["Normalize Activations 🔢"]
    D --> E["Scale and Shift 🔣"]
    E --> F[Next Layer]
Formula
Suppose channels are divided into groups.:
Each group contains:
Mean and variance are computed within each group:
Normalize:
Statistics Computed Across
For:
GroupNorm computes statistics across:
within each sample.
Advantages
- Independent of batch size
- Works well with small batches
- Excellent for detection and segmentation
Limitations
- Slightly slower than BatchNorm
- Less common than LayerNorm in Transformers
Typical Use Cases
- Mask R-CNN
- Object Detection
- Segmentation Models
- Memory-constrained CNN training
BatchNorm vs LayerNorm vs GroupNorm Comparison
| Feature | BatchNorm | LayerNorm | GroupNorm |
|---|---|---|---|
| Uses Batch Statistics | ✅ | ❌ | ❌ |
| Works with Batch Size = 1 | ❌ | ✅ | ✅ |
| Best for CNNs | ✅ | ❌ | ✅ |
| Best for Transformers | ❌ | ✅ | ❌ |
| Same Train/Inference Behavior | ❌ | ✅ | ✅ |
| Multi-GPU Friendly | ⚠️ | ✅ | ✅ |