
AWS Monitoring and Observability
Overview of Monitoring and Observability services in AWS including CloudWatch, CloudTrail, Config, and X-Ray.
Monitoring
Observing systems, collecting metrics, evaluating those metrics over time, and then using them to make decisions or take action
Logging:
All Logs must be encrypted and stored in S3. S3 bucket for log must be secured with bucket policy to avoid unauthorize
access & for further analysis by Athena. Old Logs can be moved to Glacier for cost saving
Service Logs
- Cloudtrail : all API Logs
- Cloudwatch Logs: Real time Metrics
- CloudFront Logs: Web Distribution access Logs
- VPC Flow Logs: Network logs
- ELB Logs: metadata of request coming to ELB
- WAF Logs: logging of requests analyzed by service
Amazon CloudWatch
Web service to monitor and manage various metrics and configure alarm actions based on data from those metrics.
- AWS services send Metrics to CloudWatch
- centralize the server logs for its EC2 instances and on-premises servers.
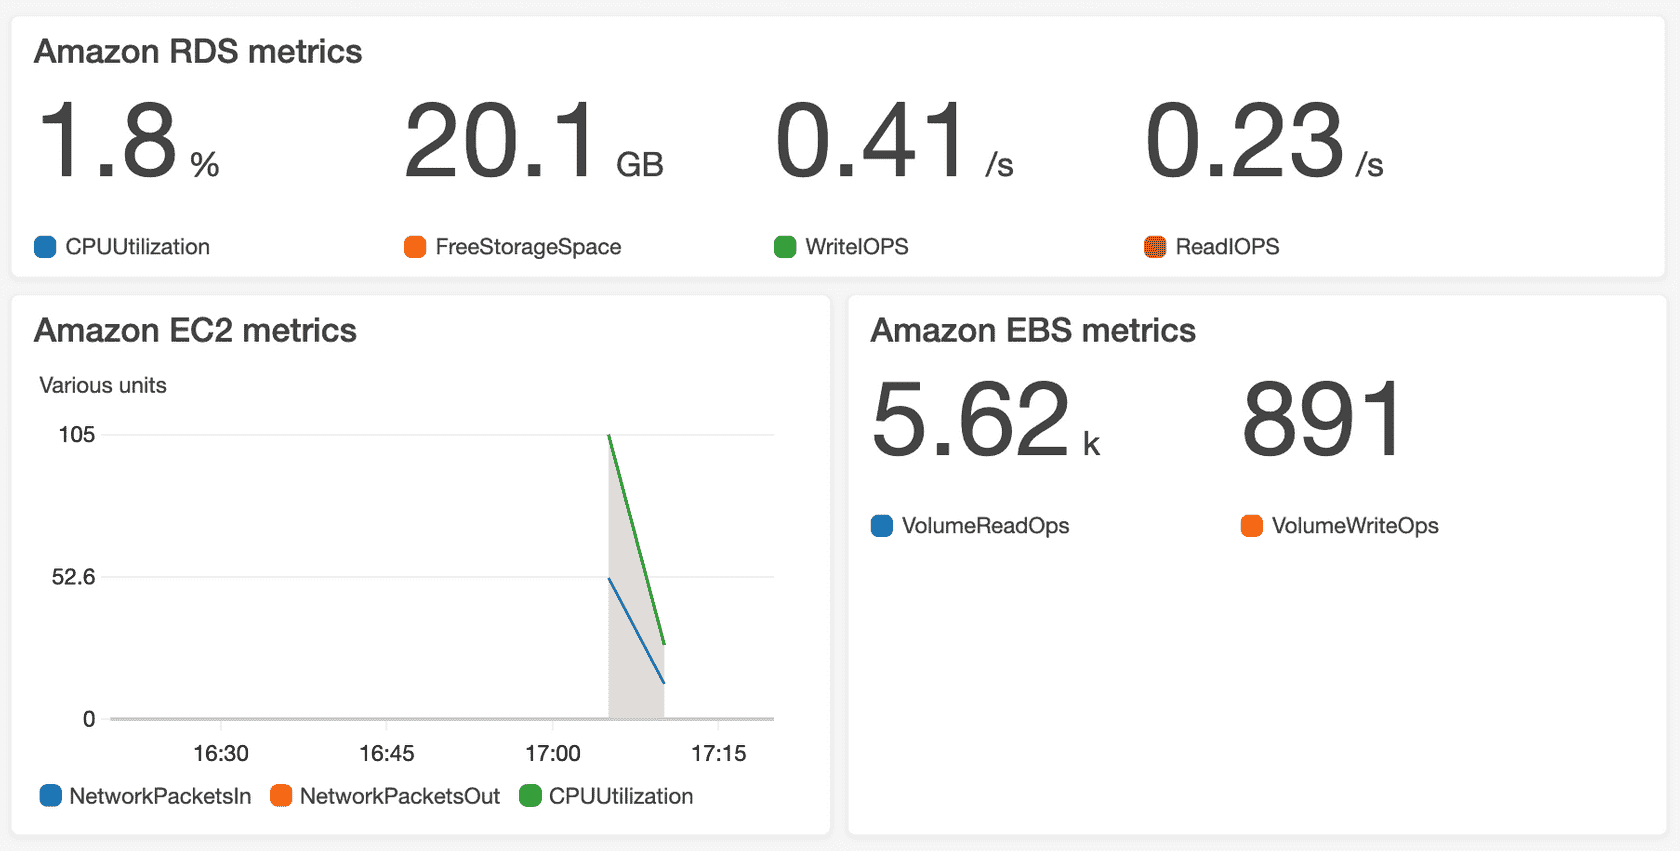
CloudWatch dashboard
Uses metrics to create graphs
- Dashboard are Global & include all Regions & Account
- Automatic refresh & time zone
- Free upto
3Dashboard(50Metrics), - More than
3Dashboard: $3/Dashboard
AWS Service Health Dashboard
Status of
all AWS serviceacross all region
AWS Service personal Health Dashboard
AWS Service event that will impact your Application
Metrics
Variable to Monitor the performance of systems.
Dimension:
Attribute in Metrics. Upto
10Dimensions Per Metric
- EC2 Instances: CPU Usage, Status Check, Network Traffic,
- Standard:
5Minutes - Detailed:
1Minute for extra cost. - RAM is not pushed and need to use custom Metric
- Standard:
- EBS Data: Disk IO
- S3Bucket:Bucket Size, Number of Object, All Request
- Billing: Estimated Cost
- Service Limit
Custom Metric
Define & send own custom Metrics
PutMetricData: set data to MetricsStorageResolution: Metric resolution- Standard:
1 Minute - High Resolution:
1/5/10/30Sec-> High Cost
- Standard:
- TimeStamp: Can push Data upto
2 Week In Pastand2 Hour in Future
CloudWatch Logs
Real time collection & monitoring of logs on Cloud Watch for troubleshooting
-
Collect Logs from
- Elastic Bean stalk
- ECS: System Logs
- Lambda & API Gateway: Function Logs
- Route 53: DNS Logs
- VPC flow logs: Network Logs
- CloudWatch Logs Agent on EC2 Instance
- SDK
- On premises Server
-
Log Group: group of Logs Stream
-
Log Stream: Logs from various sources
-
Log Expiration Policy: Set expiry date of log to save cost on storage
-
Metric Filter: Filter out logs to create Metric and trigger Alarm
- Count number of occurrence eg ERROR
- Filter Data for new events after creation of filter
-
Log Insights: Query on Logs to get Insight
-
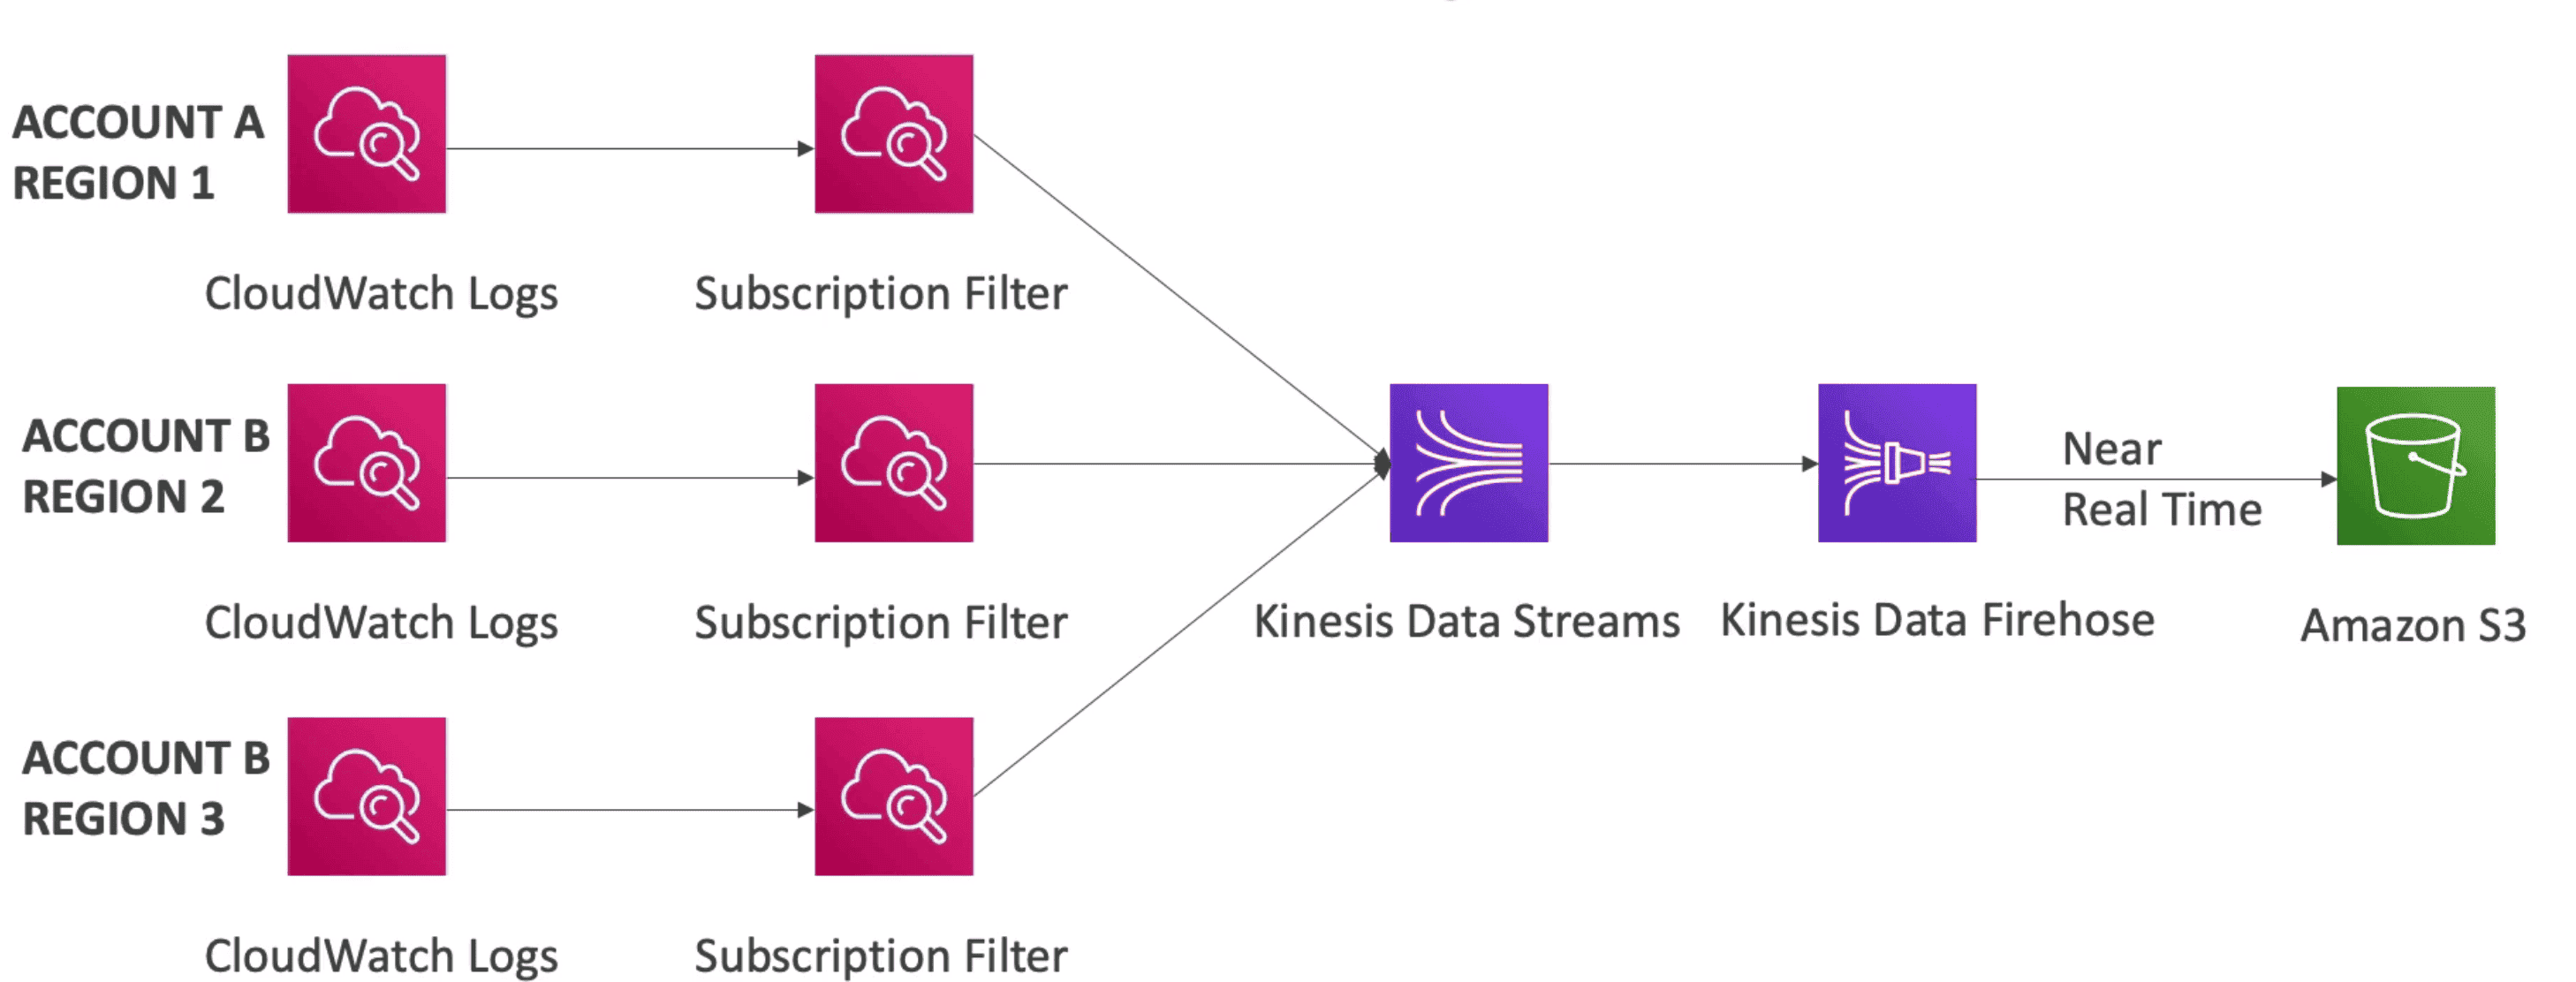
Log Aggregation: Centralize all Logs together cross Account & Cross Region
-
Export CW Logs:
-
S3 Export:
export logs from CloudWatch to S3 in
near real time.- Use
createExportTaskAPI and can take upto12 hours.
- Use
-
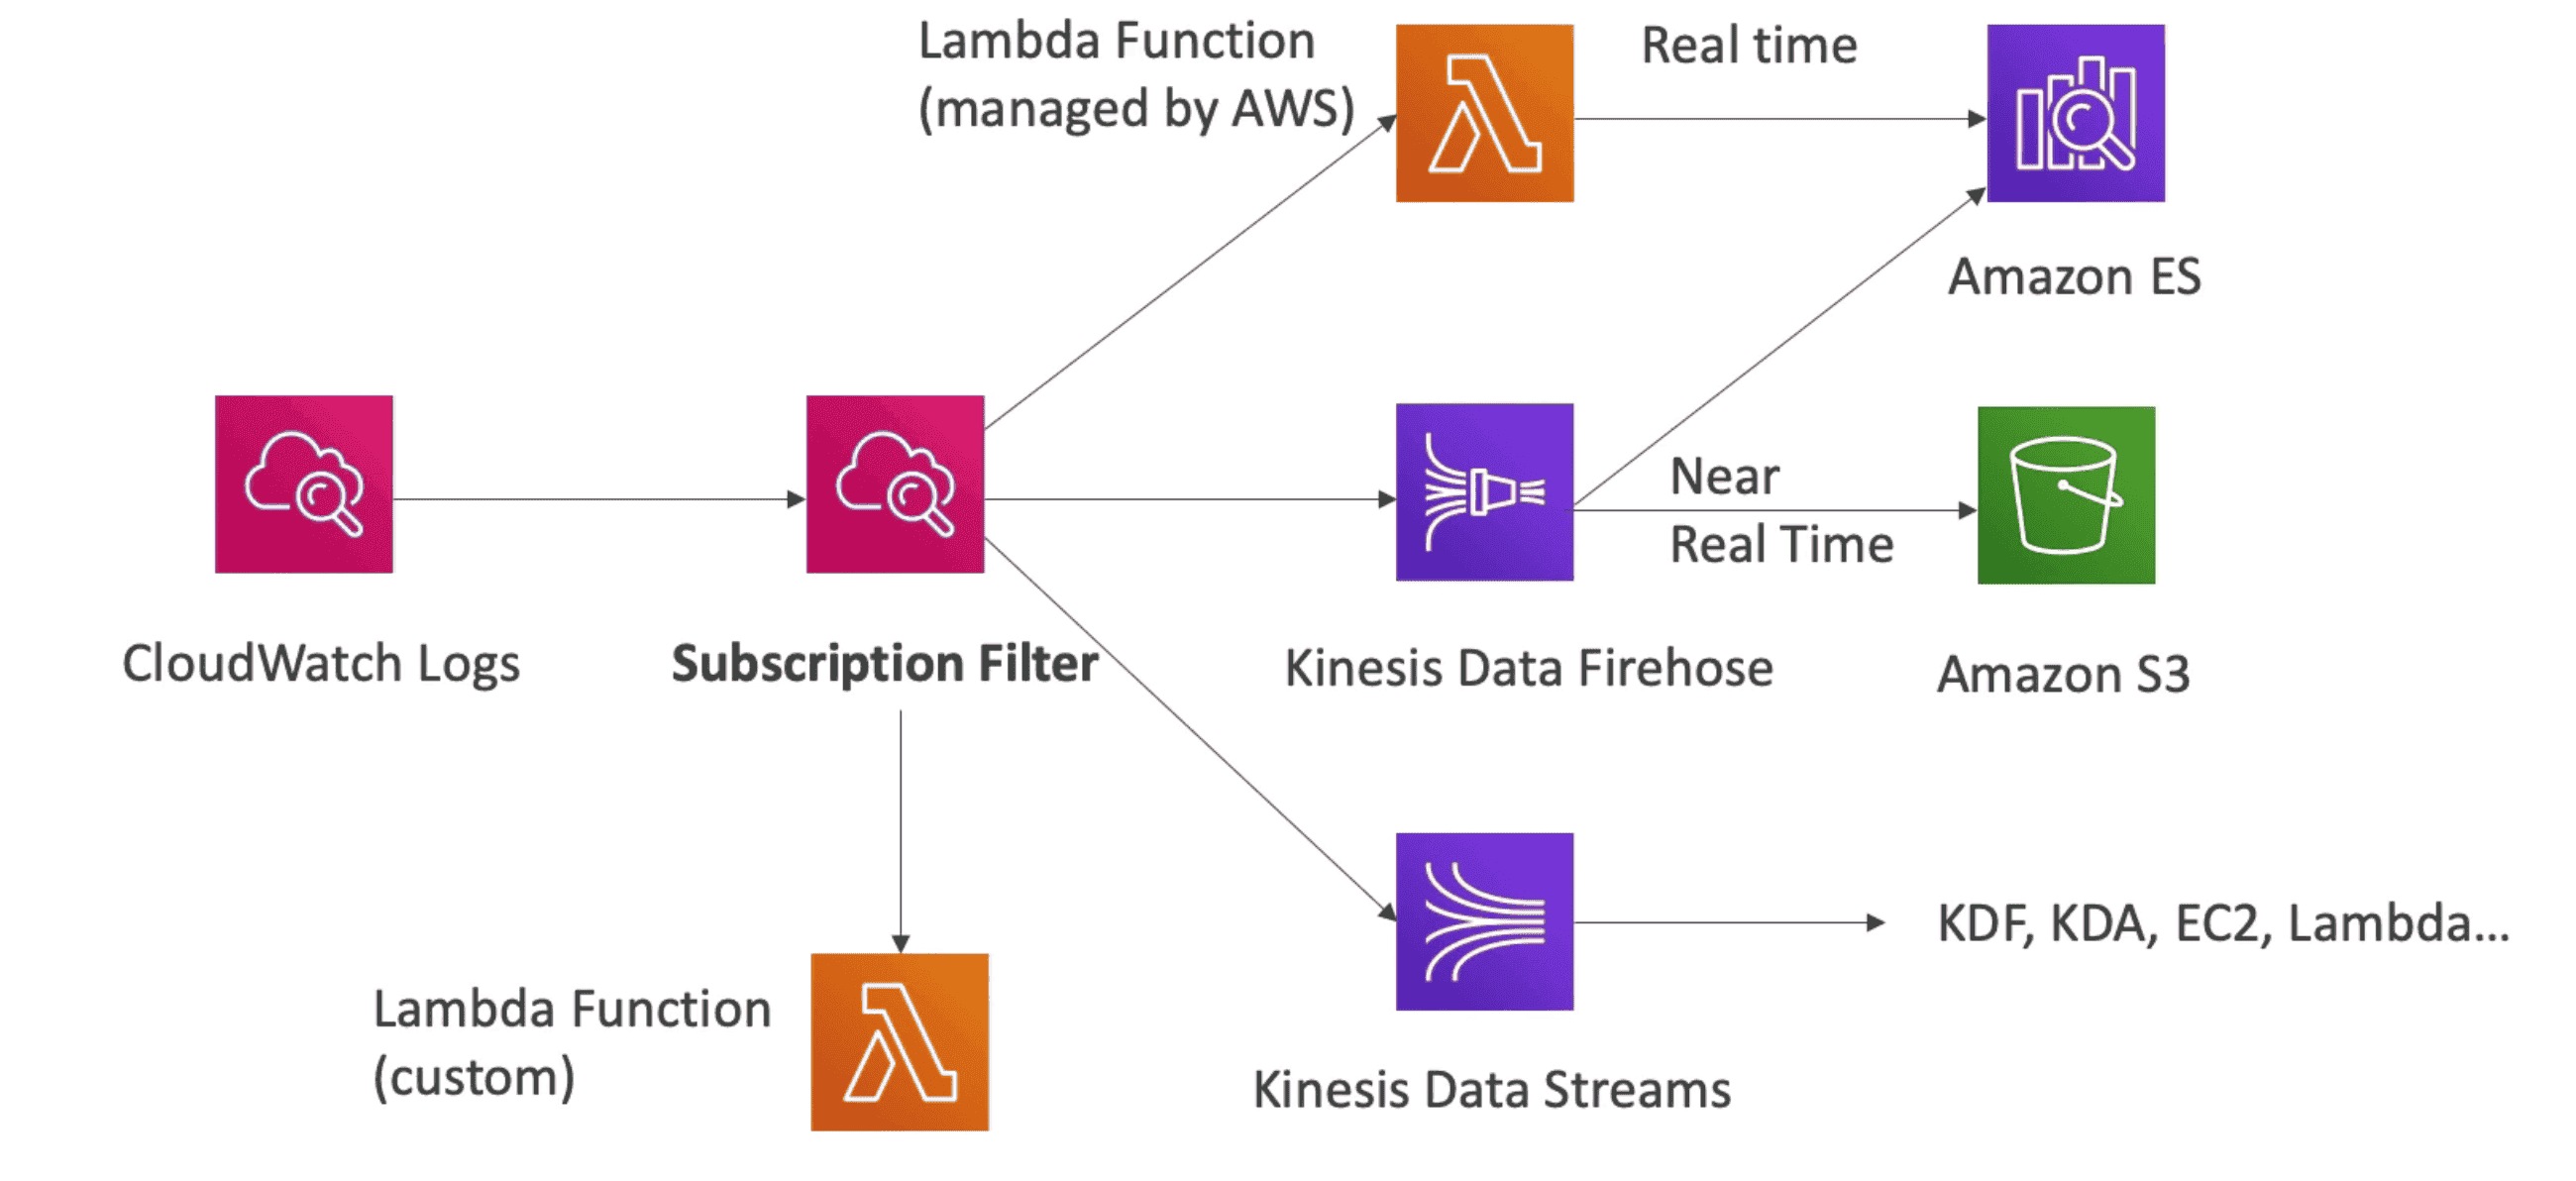
Subscription:
Filter for exporting CW logs in
Real time- Export logs to:
- Lambda
- Kinesis Data Stream
- Kinesis Firehose
- Elastic Search
- Export logs to:
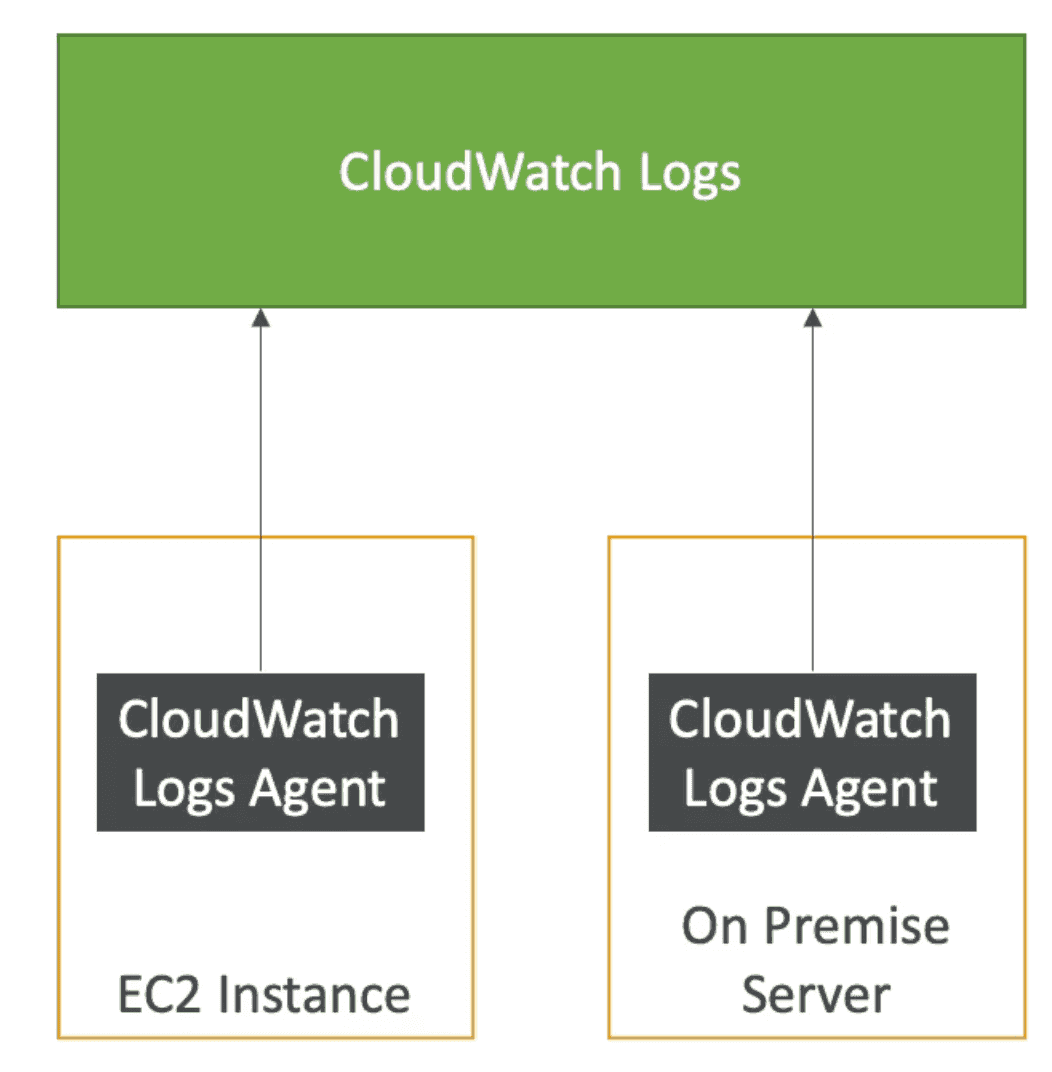
Cloud Watch Log Agent
Send Logs from EC2 Instance to Cloud Watch
- By default no logs goto CW from EC2 Instance without Agent
- Agent can be setup with on premises Server
Agent Type
1. Cloudwatch Log Agent
- Old version of agent
- Send logs to CW
2. Cloudwatch Unified Agent
-
Send Logs + System
Metricsto CW -
Centralized configuration with
SSMParameter Store -
Make sure Agent have proper IAM permission to access SSM and upload logs to CW
-
Metrics have prefix:
CWAgentwhich can be changed -
Collect directly on
EC2/Linux -
ProcStatPlugin used to send logs for process on Windows/Linux EC2 instance- Metric name start with procstat
- Process can be selected by pid_file, exe(process name regex), pattern
-
Give more granular Insight of System
- CPU(active, guest, idle, system, user, local)
- DISK (free, used, total)
- DISK IO(iops, read, write, bytes)
- RAM(free, inactive,used, total, cached)
- NetStats(packets, bytes, connections)
- Processes(total, dead, running,idle, sleep)
- Swap Space(fee, used)
CloudWatch Alarms
Automatically trigger Notification to perform actions if the value of metric has gone above or below a predefined threshold.
- Can be set using Metrics Filter in Cloud Watch Logs
- Can be triggered from CLI for testing
Interval
- Standard Metric: Triggered at
1 MinuteInterval - High Resolution Metric: Triggered at
10/30/ Multiple of60 Sec
Alarm States
OKNot triggeredINSUFFICIENT_DATAALARM(Threshold met)
Targets:
- EC2
- Stop, Terminate, Reboot, Recover EC2 instance
- ASG
- Increase decrease EC2 Instance
- SNS
- SNS Notification, Billing Alarm
CloudWatch Event / Event Bridge(Now)
React to intercept events happening in AWS services & react to them
- Intercept any API Call from Source to create
JSONPayload for target - Can be triggered periodically or pattern based eg. trigger event when root user login
- Event can trigger SNS topic to send email notification for actions in AWS
Event Bridge (Evaluation of CW Event)
Event bus for AWS & partner Services to create custom event bus.
-
Built on top of CloudWatch Event to allow extending beyond AWS Events.
-
Default Event Bus: Event bus used by AWS
-
Partner Event Bus: Event bus used by Third Party Software
-
Custom Event Bus: Event bus used by Own Web App
-
Schema Registry: Analyze events in event but to Infer schema
- Schema can be versioned
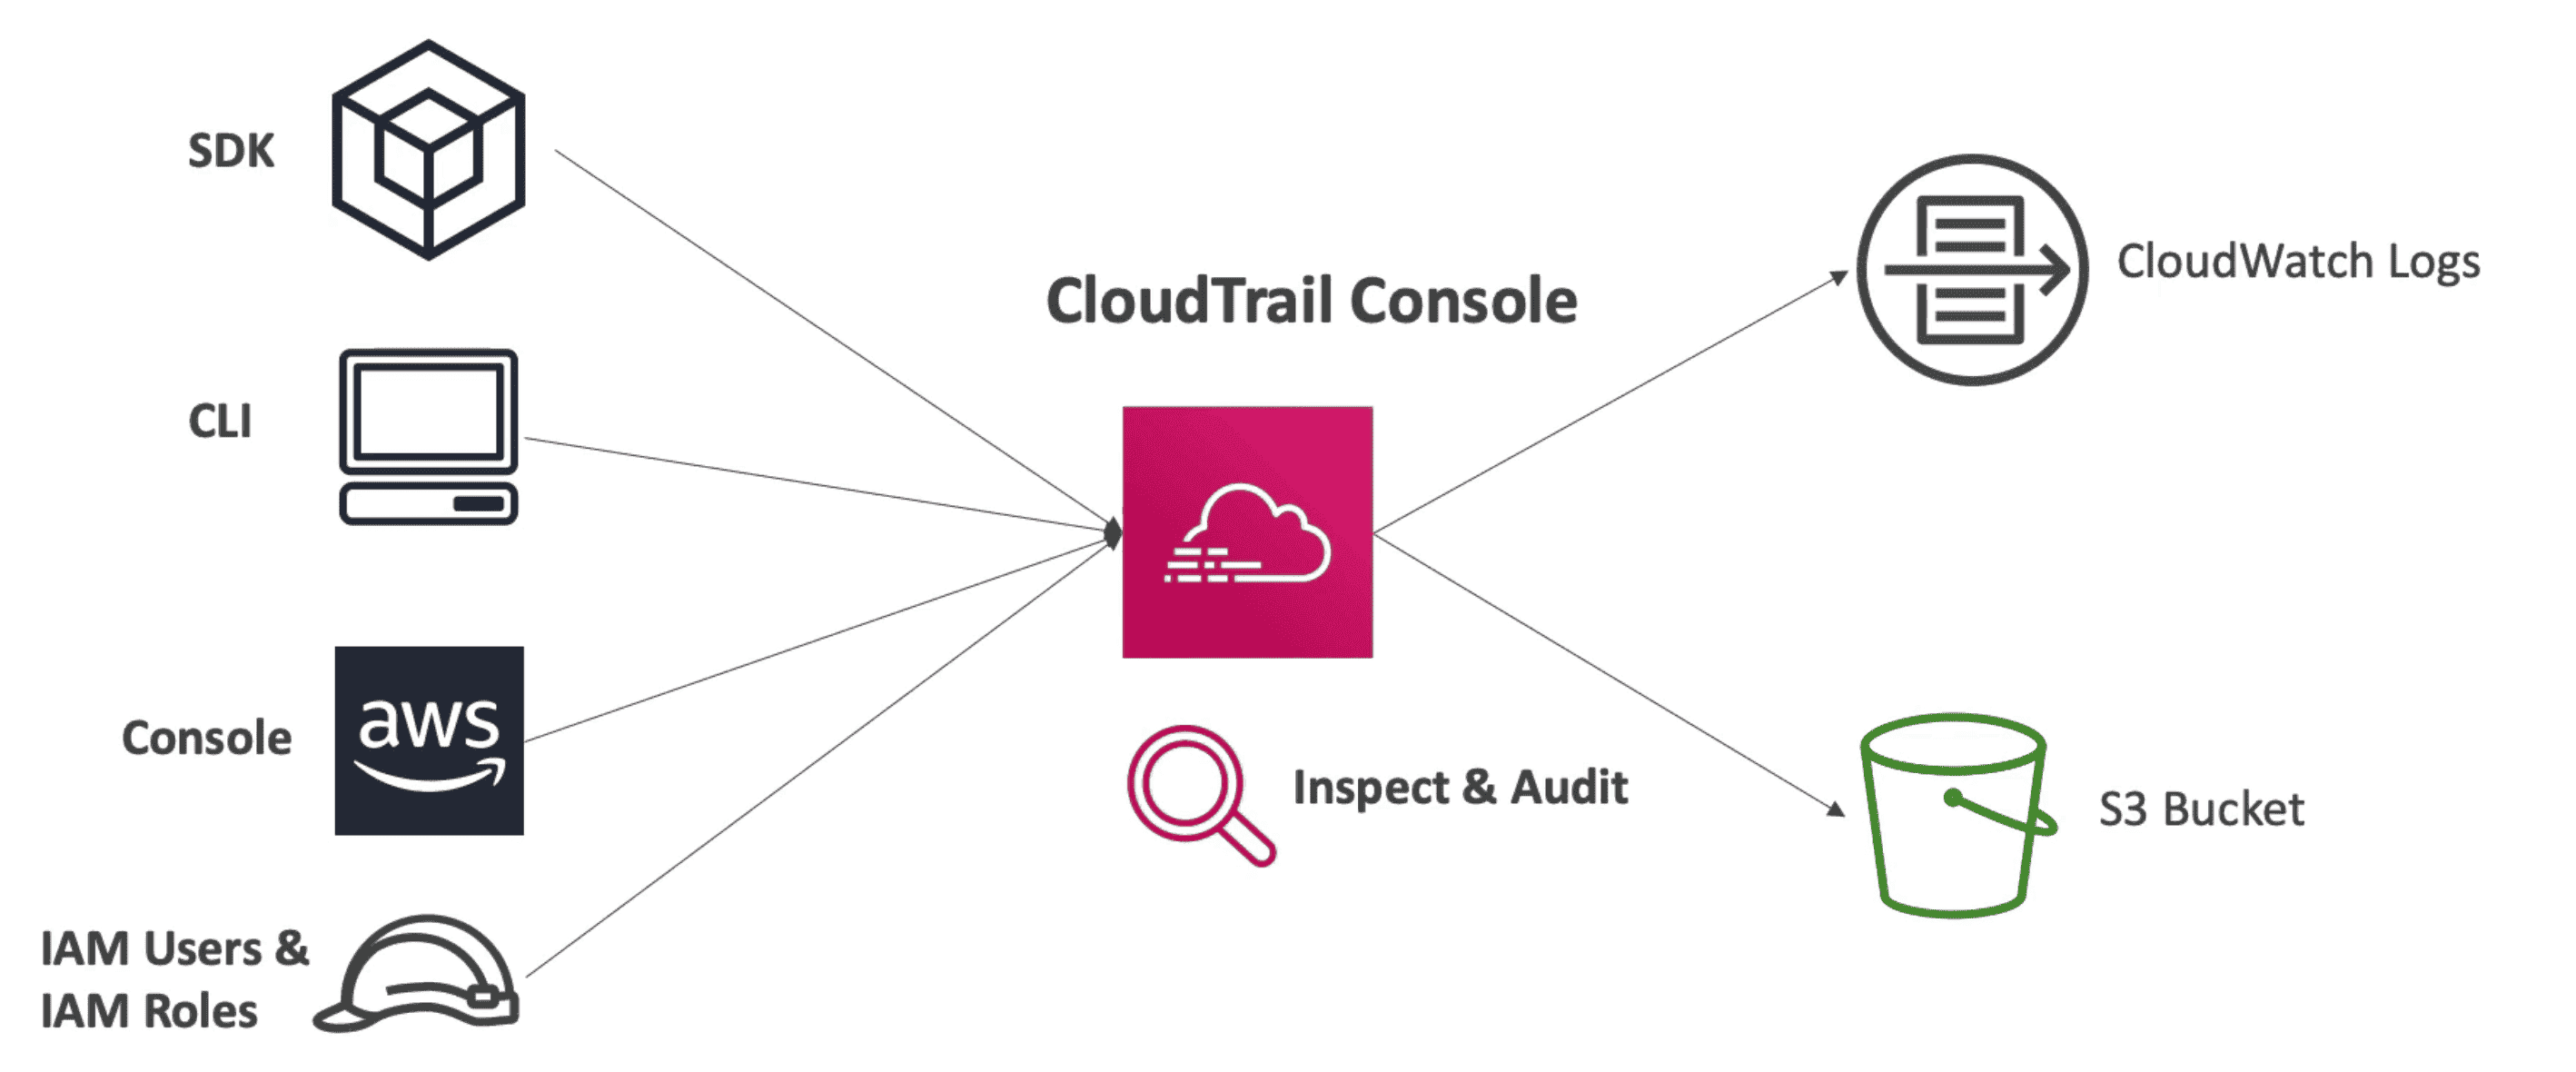
AWS CloudTrail
Governess, Compliance, Auditing tool record each API call log from Console, CLI, SDK, & other IAM users
- Near real time Analysis of state of system for inspect or Audit
- Enabled by Default
- Can be applied to all regions(Default) or single region
- Every action is recorded as Event within
15 Minute & retain for 90 days - Move Events to S3 to keep them for longer period
Event Types:
1. Management Events
Operation performed on resources
- Logged by Default
- Can be separate into Read & Write Operation
2. Data Event
Operation on Data
- Not logged by default due to high volume
- Can be separate into Read & Write Operation
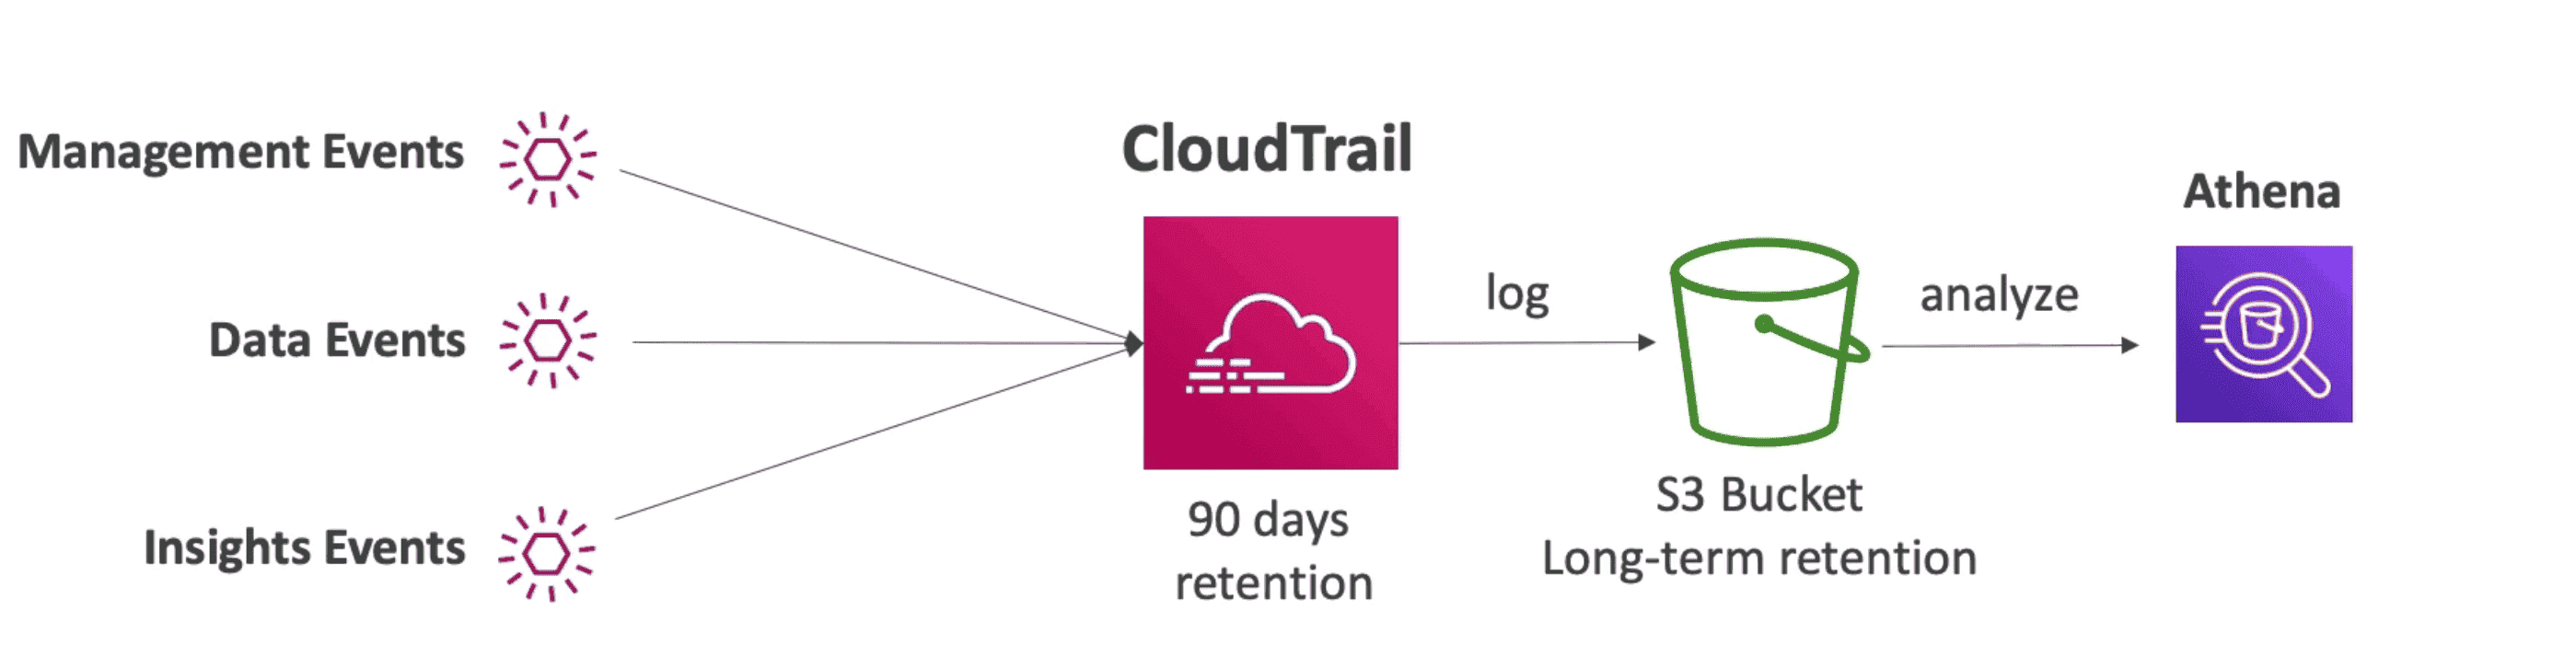
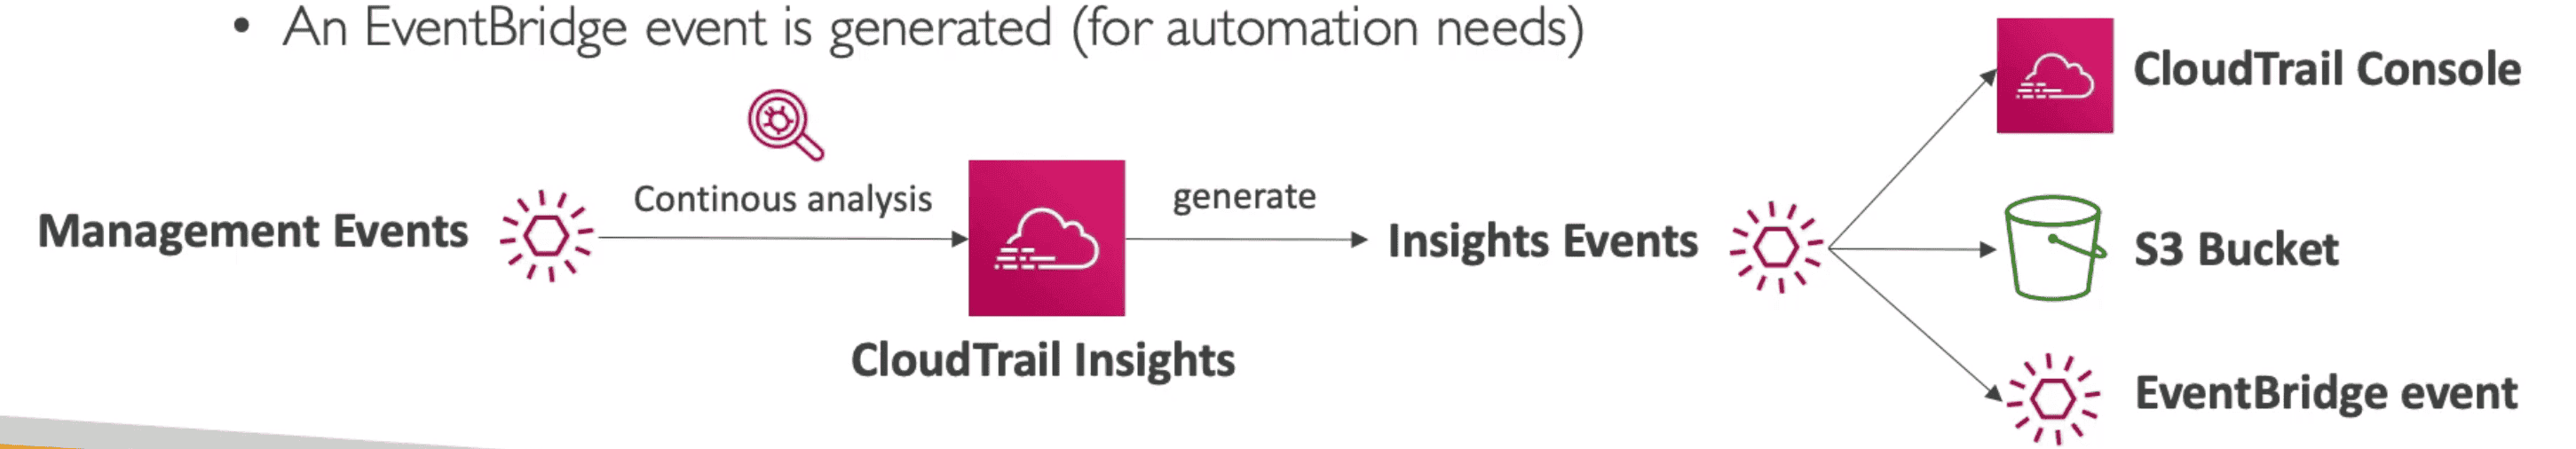
3. CloudTrail Insights Event
optional paid feature allows CloudTrail to automatically detect unusual API activities AWS account.
- Analyze Activity and detect anomaly
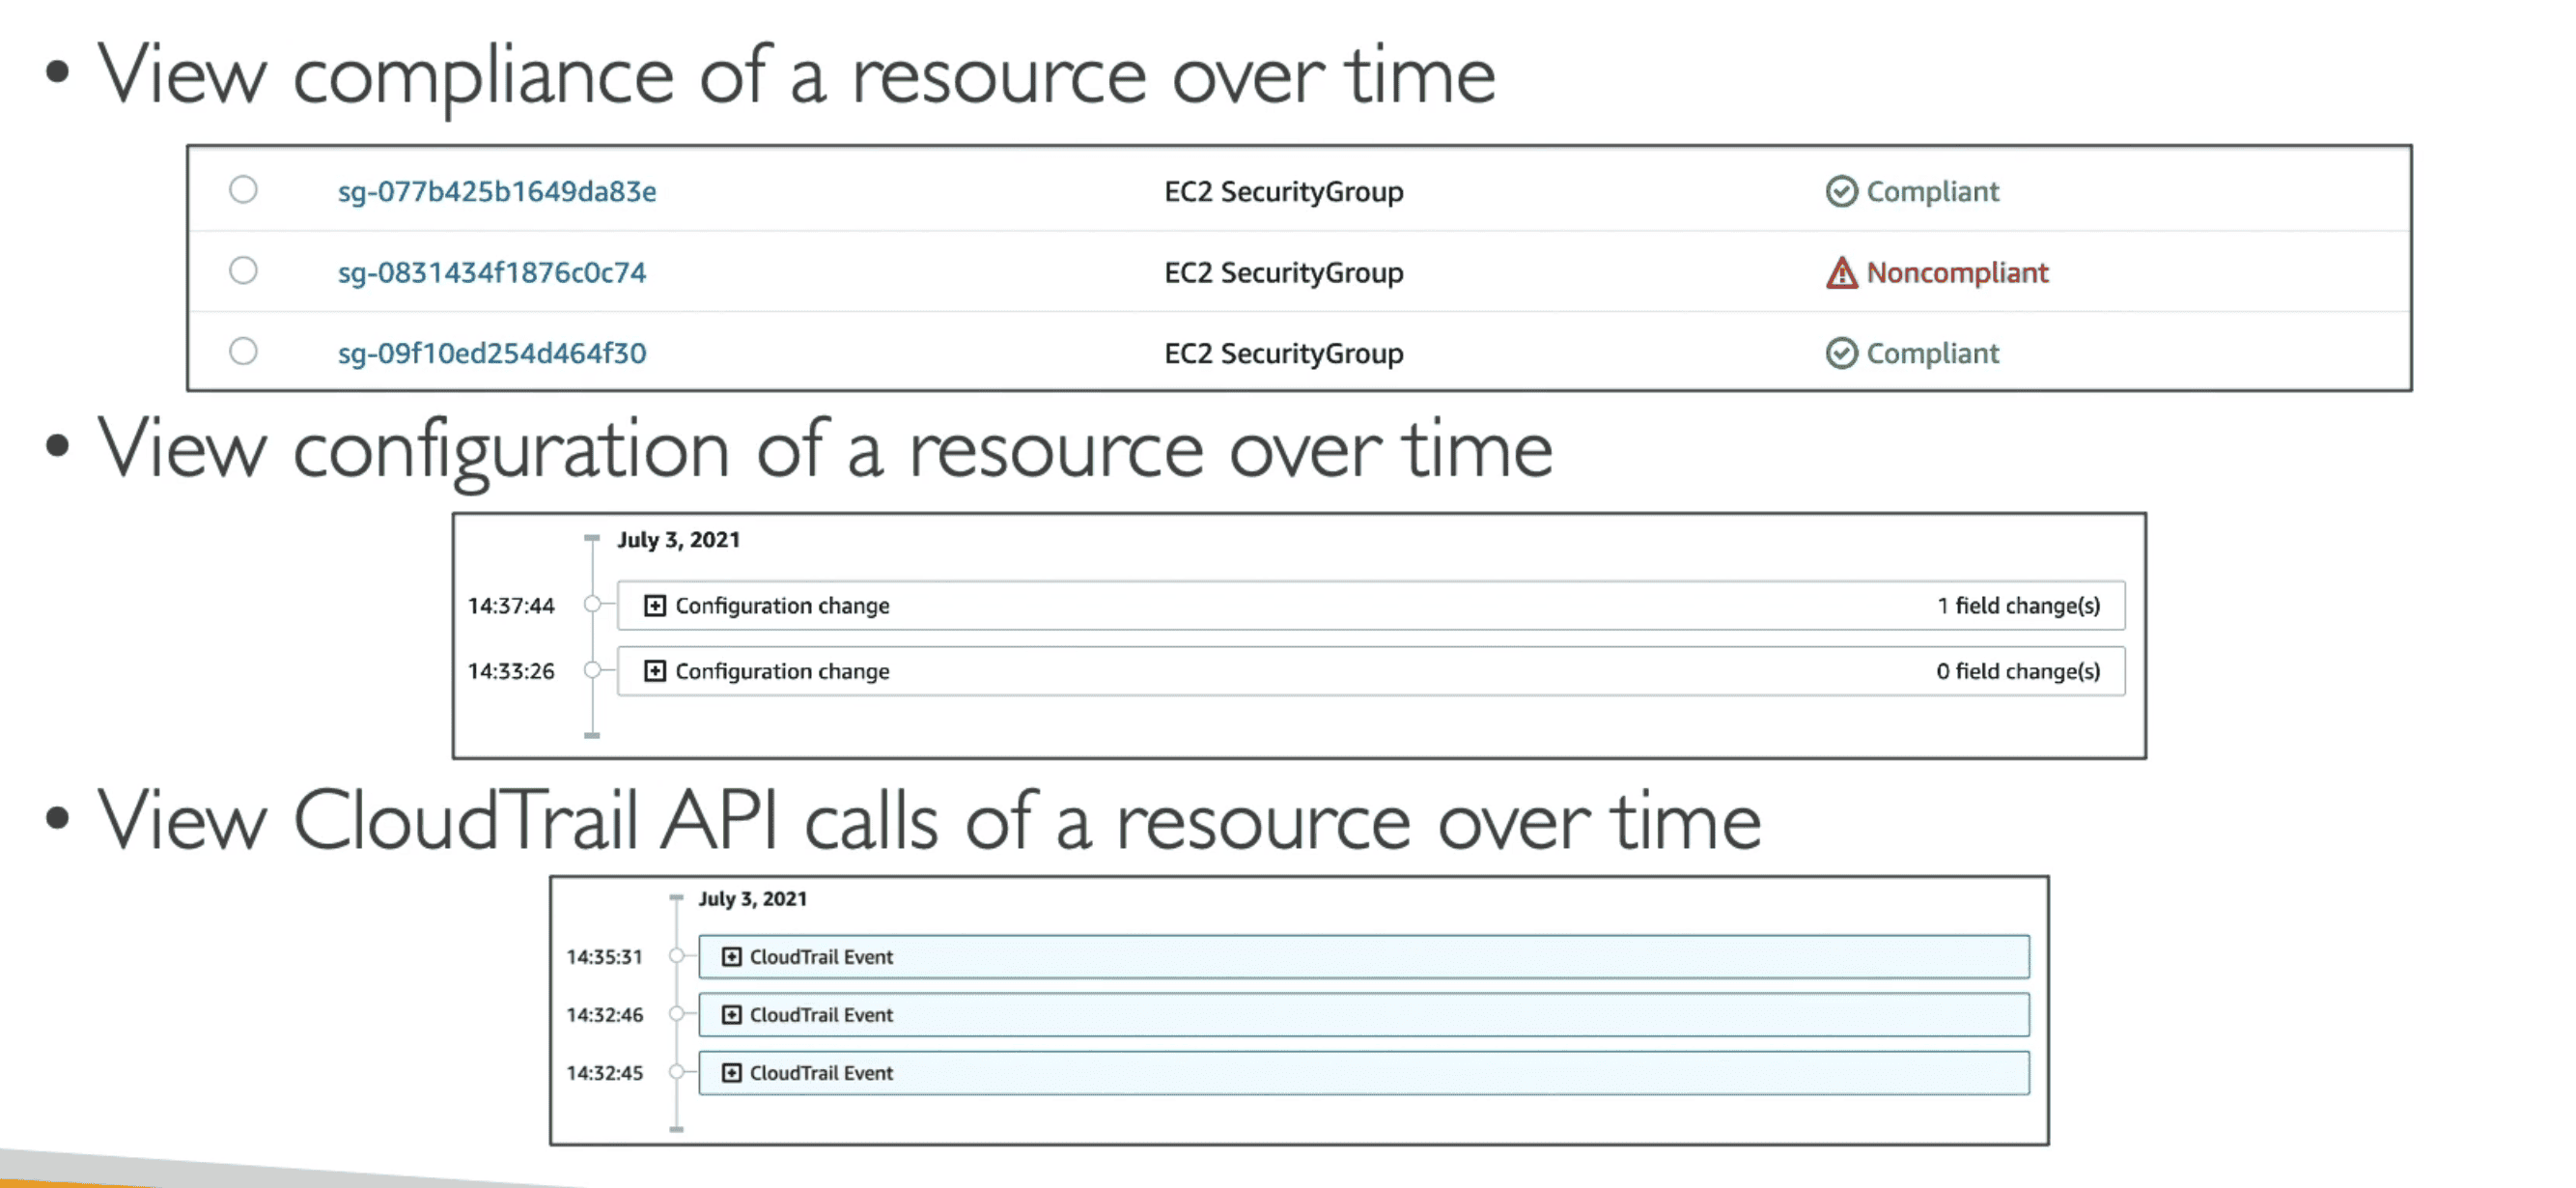
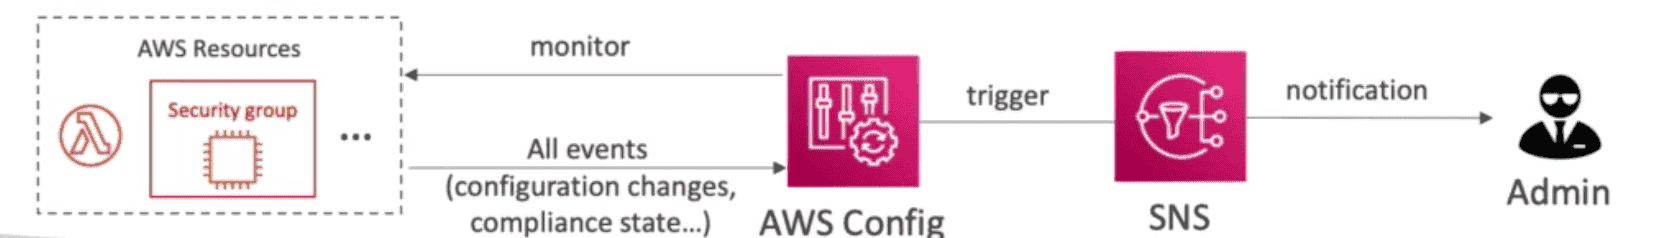
AWS Config
paid service to Store Config of Infrastructure over time
- Compliance as Service
- Record config and changes over time and can be stored in S3 for making queries using Athena
- Trigger alert by SNS when it changes
- Region level service but can be aggregated
- Does not Deny non compliant resources
Config Rules
Check Compliance of resources again set of rules defined by config
- AWS provides 100s of managed rules (count keeps growing) or can be custom defined
- Can be evaluated or triggered at regular interval
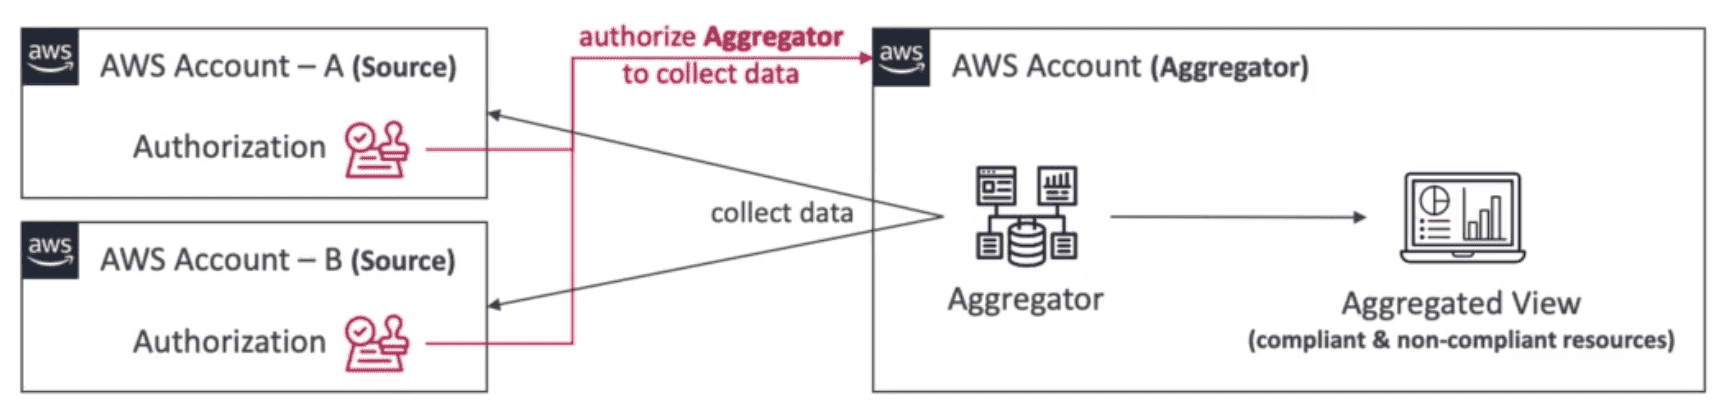
AWS Config Aggregator:
AWS Account giving aggregated view of all accounts and region to create single Aggregator view
- Only 1 Aggregator per Central AWS account
- AWS organization give permission to Aggregator to collect data
- If not using AWS org we need to give authorization to collect data from source account
- Rules are manged by individual account
AWS Config Remediation
Remedy the non compliant resource automatically
AWS Config Notification
Trigger Notification when Compliance breaks
AWS Config -> What is changed AWS Cloudtrail -> Who changed it AWS CloudWatch -> Watch impact on System due to Change
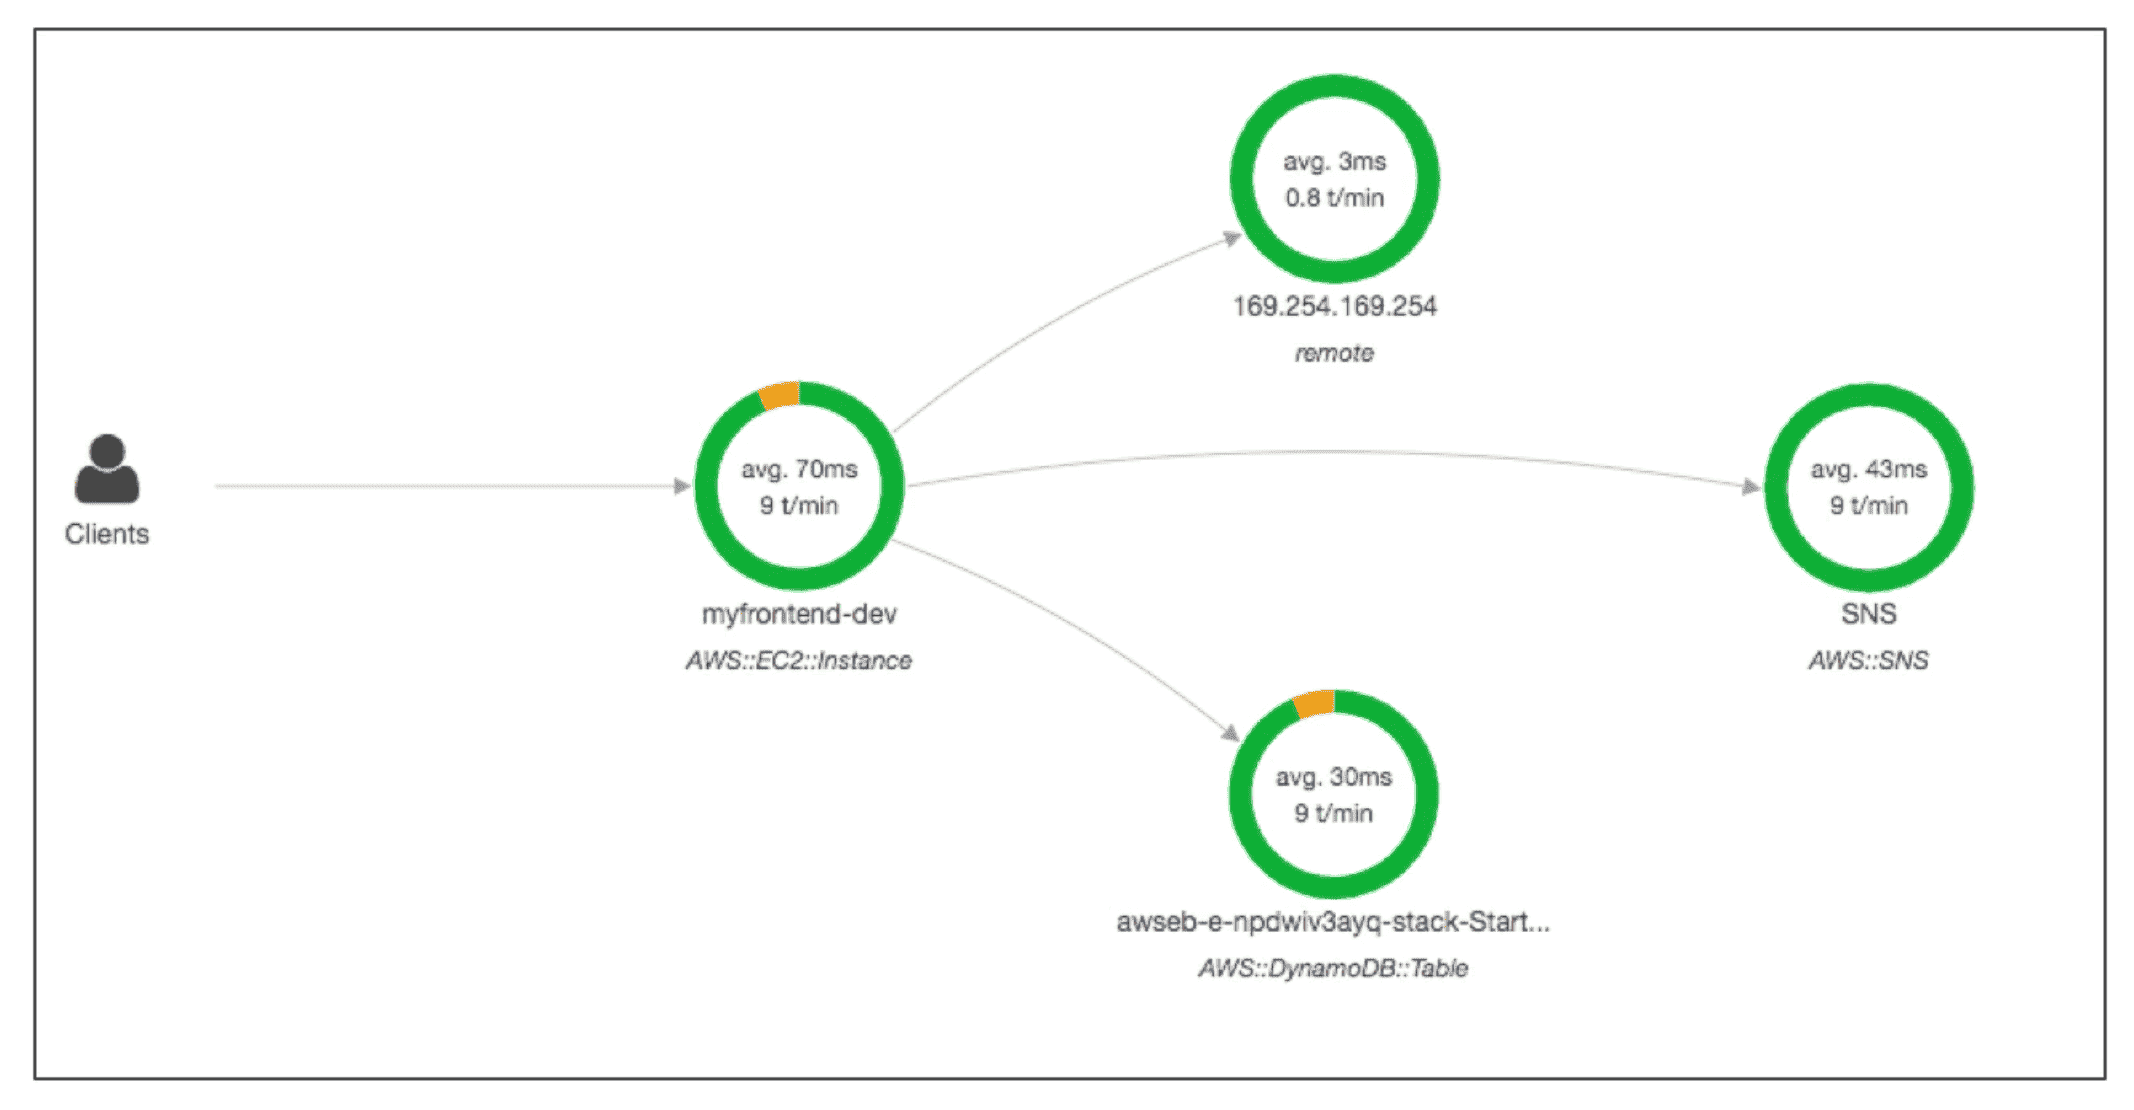
AWS Xray
Visual Analysis of Distributed Application.
- Understand dependency in
microservice architecture - Shows a map of application’s underlying components.
- Troubleshoot performance(find bottleneck)
- Pin Point Service causing issues
- Find Error & Exceptions
- Validate Time SLA & identify impact on service outage on users
debug and trace data Across Accounts
Compatible with:
- EC2:
IAM Permissionmust be given to write to XRayXRayDemonmust be running
- Lambda
IAM Execution Rolewith proper policy (AWSX-RayWriteOnlyAccess)- XRay is imported into code
- Enables Xray integration
- ELB
-
ECS
- 2. Run Xray Container as1. Run Xray Container on EC2 instances running ECSSideCarwith each App Container in EC2- 3.Run Xray COntainer as Sidecar in FarGate running in ECS Cluster
- API Gateway:
- BeanStalk
-
Enable Xray Demon by
- 2. Set configuration in1. Setting option in Beanstalk console OR.ebextension/xray-demon.config IAM Permissionmust be given instance profile to write to XRay- XRay is imported into code
-
Tracing:
Give an end-to-end view of requests as they travel through application.
- Each component dealing with request give a
Trace. - Trace is made of
Segmentswhich further divide intoSubSegment. AnnotationKey Value Pair to create Index of trace & apply filterMetaDataKey-Value Pair, cant be indexed or searchedSamplingdecrease amount of request to decrease cost- Security: Use KMS at rest with IAM Authentication to assume a role
Sampling Rule
Control amount of data sent to Xray to save cost
- Default Rule: Reservoir + 5% Rate
- Reservoir: first request each second to make sure at least 1 request get registered
- Rate: Percentage rate at which additional request are traced beyond reservoir
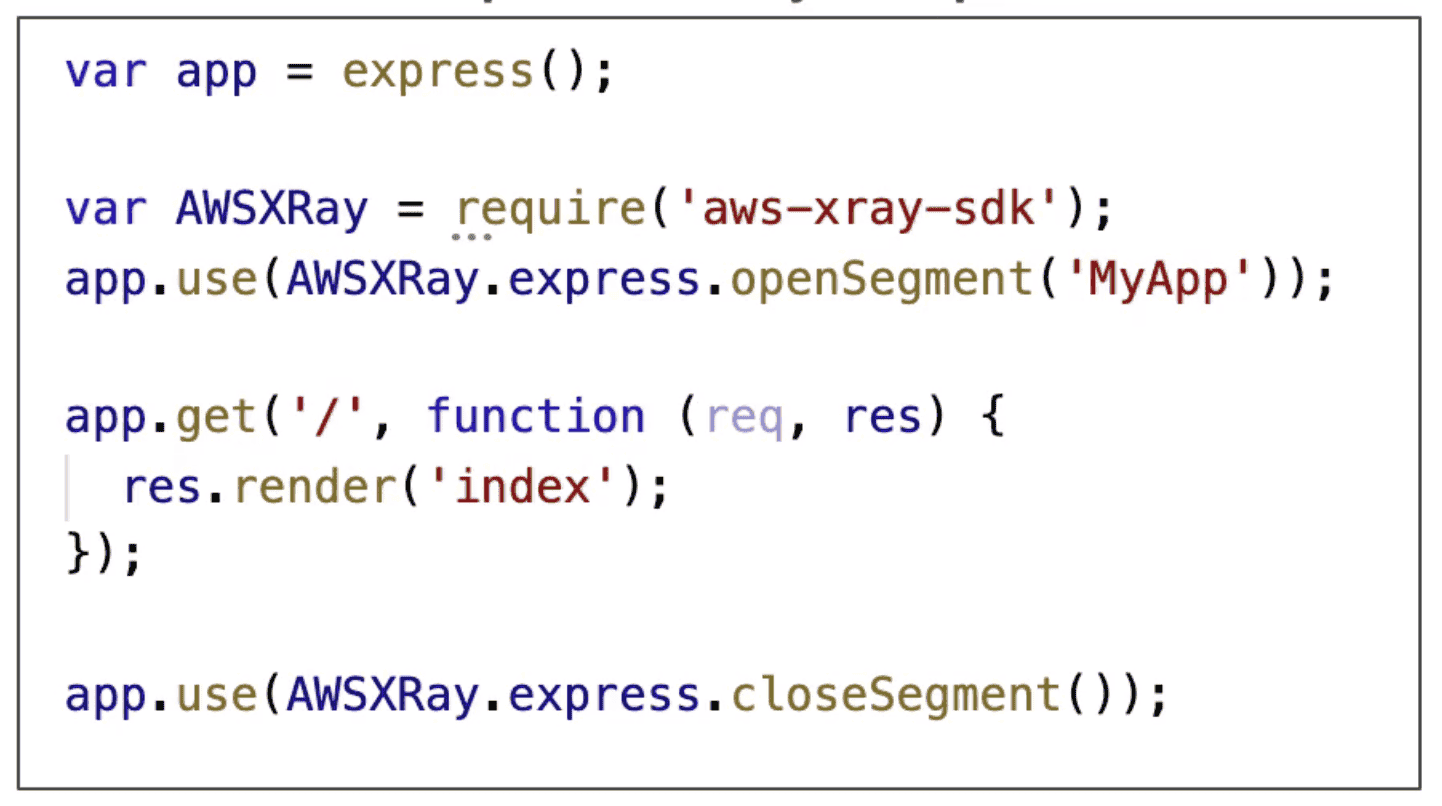
Xray SDK
App need to import SDK into code for tracing with little bit of app modification
- Supports: Java, Node, Python, Go, .NET
- Captures
- HTTP/S Request
- AWS Service calls
- DataBase Call
- Queue Calls
Xray Demon
Must Install on local Machine or Enable in AWS Resource to intercepting Packets
- App Must have IAM right to write to XRay
- AWS Already have Demon installed we need to Enable it
Xray Write API (Used by Xray demon)
| API | Usage |
|---|---|
| WRITE | |
| PutTraceSegments | write segment to Xray |
| PutTelemetryRecord | Write Telemetry Data eg Segment receive, reject, count |
| GetSamplingRules | Write Sampling Rule |
| GetSamplingTarget | Write Sampling Target |
| GetSamplingStatisticSummaries | Write Stats |
| READ | |
| BatchGetGraph | Get List of Traces specified by ID |
| GetServiceGraph | Get Main Graph |
| GetTraceGraph | Get Specific service Graph |
| GetTraceSummaries | Get Traces ID & Annotations |
| GetGroup | |
| GetGroups |