Azure Monitoring and Observability
Overview of Monitoring and Observability services in Azure including Azure Monitor, Application Insights, Log Analytics, Alerts and more.
MONITORING
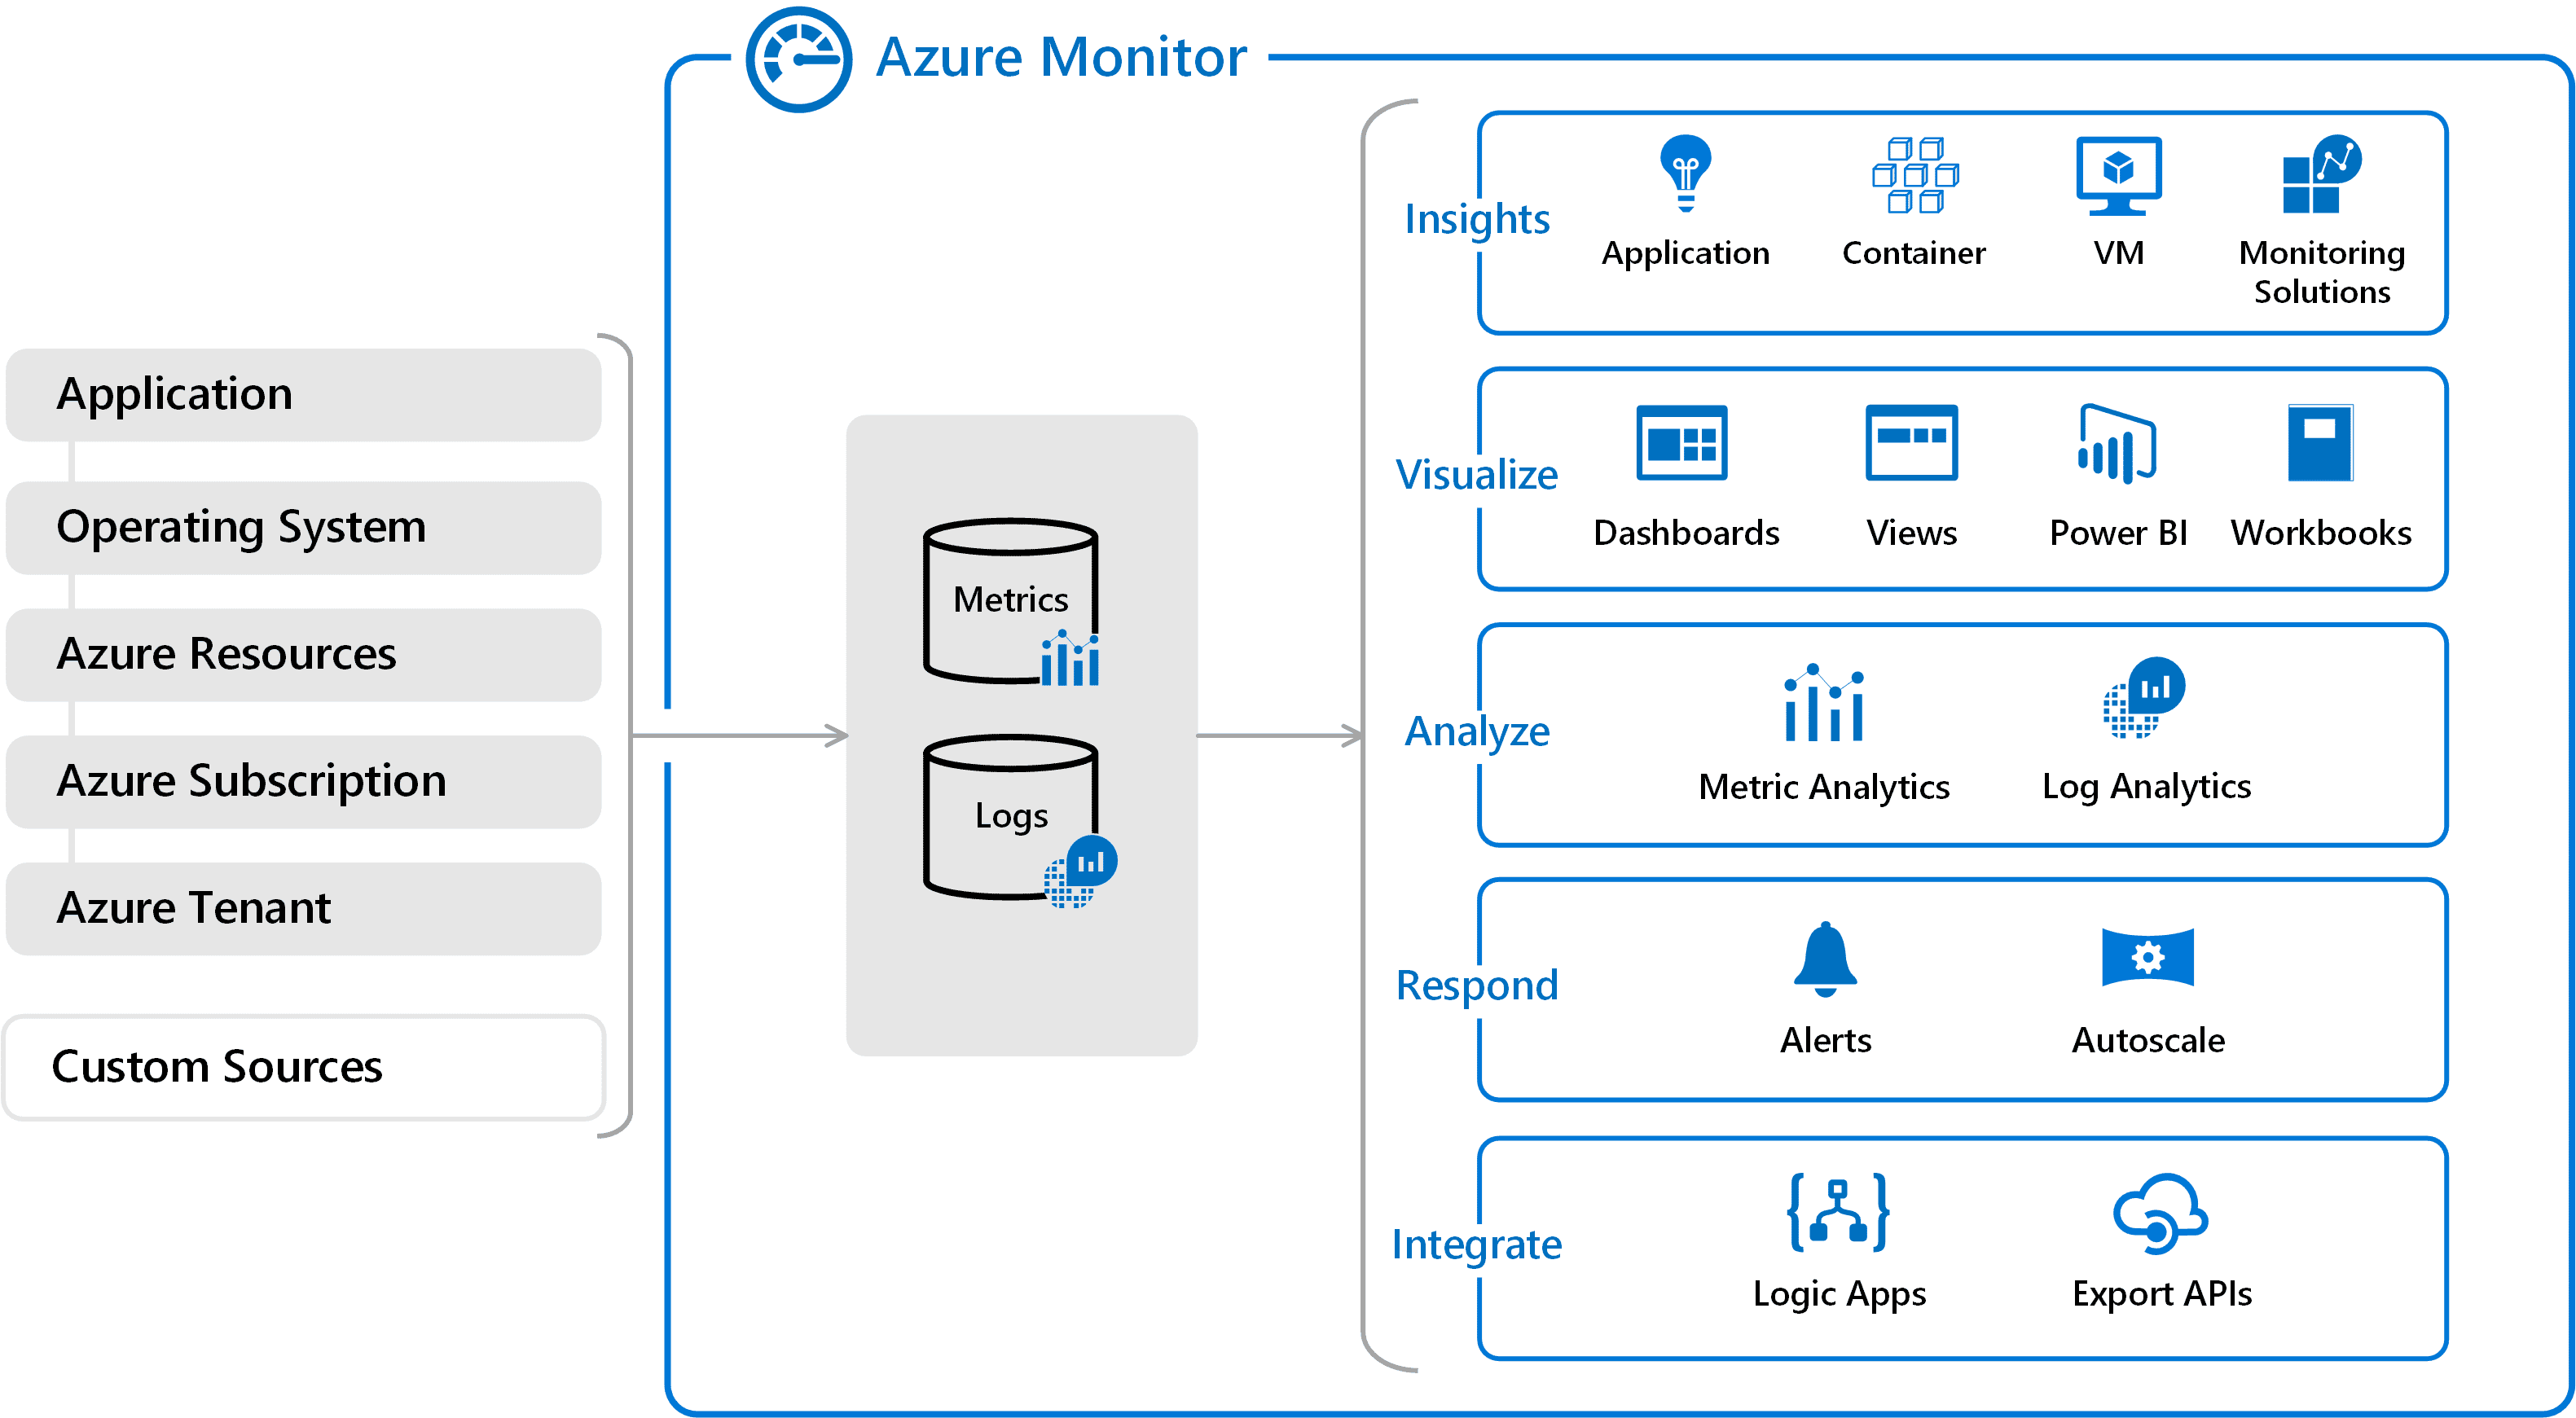
AZURE MONITOR
Collect, analyze & respond by creating alerts and events
Monitors
- Storage: Performance, capacity, and availability of storage accounts.
- Network: Health and metrics of all network resources.
- DB: Overall performance, capacity, failures, and operational health of all Azure Cosmos DB resources and Azure Cache for Redis.
- Key: Unified view of all Azure Key vaults’ requests, failures, operations, and latency.
Pricing
- Pay for ingestion and retention of data in Log Analytics (per GB/month).
- Billed for the number of metrics you have per month.
- No charges for health criteria alerts.
STEP 1: Collects:
1. Logs
Events and traces are stored as logs in addition to performance data
2. Metrics:
Metrics are numerical values that describe some aspect of a system at a particular point in time.
- Represent time-ordered set of data points that are published to Azure Monitor.
- Stored for a maximum of 93 days.
- The data is stored as a set of records in either the Log Analytics or Application Insights.
Metrics Types:
1. Standard metrics
- Better performance at query time due to aggregation during collection
- ideal for real time data & dashboard
- pre-aggregated during collection
- Stored as a time series and only with key dimensions which enables near real-time alerting on dimensions of metrics, more responsive dashboards.
2. Log based Metrics
- Add extra values(Dimensions) to Metrics
- ideal for data analysis and ad-hoc diagnostics.
STEP 2: Visualize & Insight
Azure Service Health
Notifies about Azure service incidents and planned maintenance so you can take action to mitigate downtime.
Provide Personalized view of the status of Azure services and regions.
- Azure status
service outages in Azure.
- Service Health
Customized view of your services’ health in a region.
- Resource Health
Health information on your Azure resources.
Track any alerts and issues in real-time and get full reports once resolved. You can configure alerts to notify you about active and upcoming service issues.
Active events in service health:
- Service issues
- Planned maintenance
- Health advisories
- Security advisories
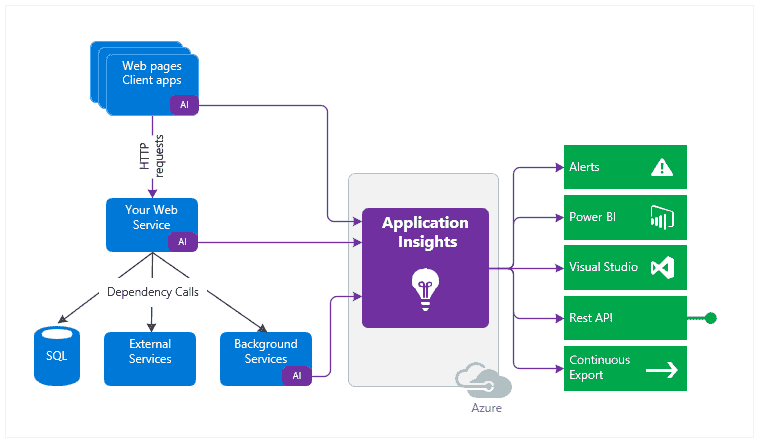
Application Insights
Monitors the availability, performance, and usage of your web applications
- Works on both on cloud or on-premises hosted application
- Enables monitoring of custom events and metrics.
- diagnose errors without waiting for a user to report them.
- Identify performance anomalies, diagnose issues, and understand user activities in live applications.
Monitor diagnostic trace logs App & send directly to Azure Monitor using unique GUID(Instrumentation Key)
Can be enabled using
Small instrumentation package (SDK)
- Supports:
Java, Node.js, JavaScript, NET, .NET Core,
Application Insights Agent
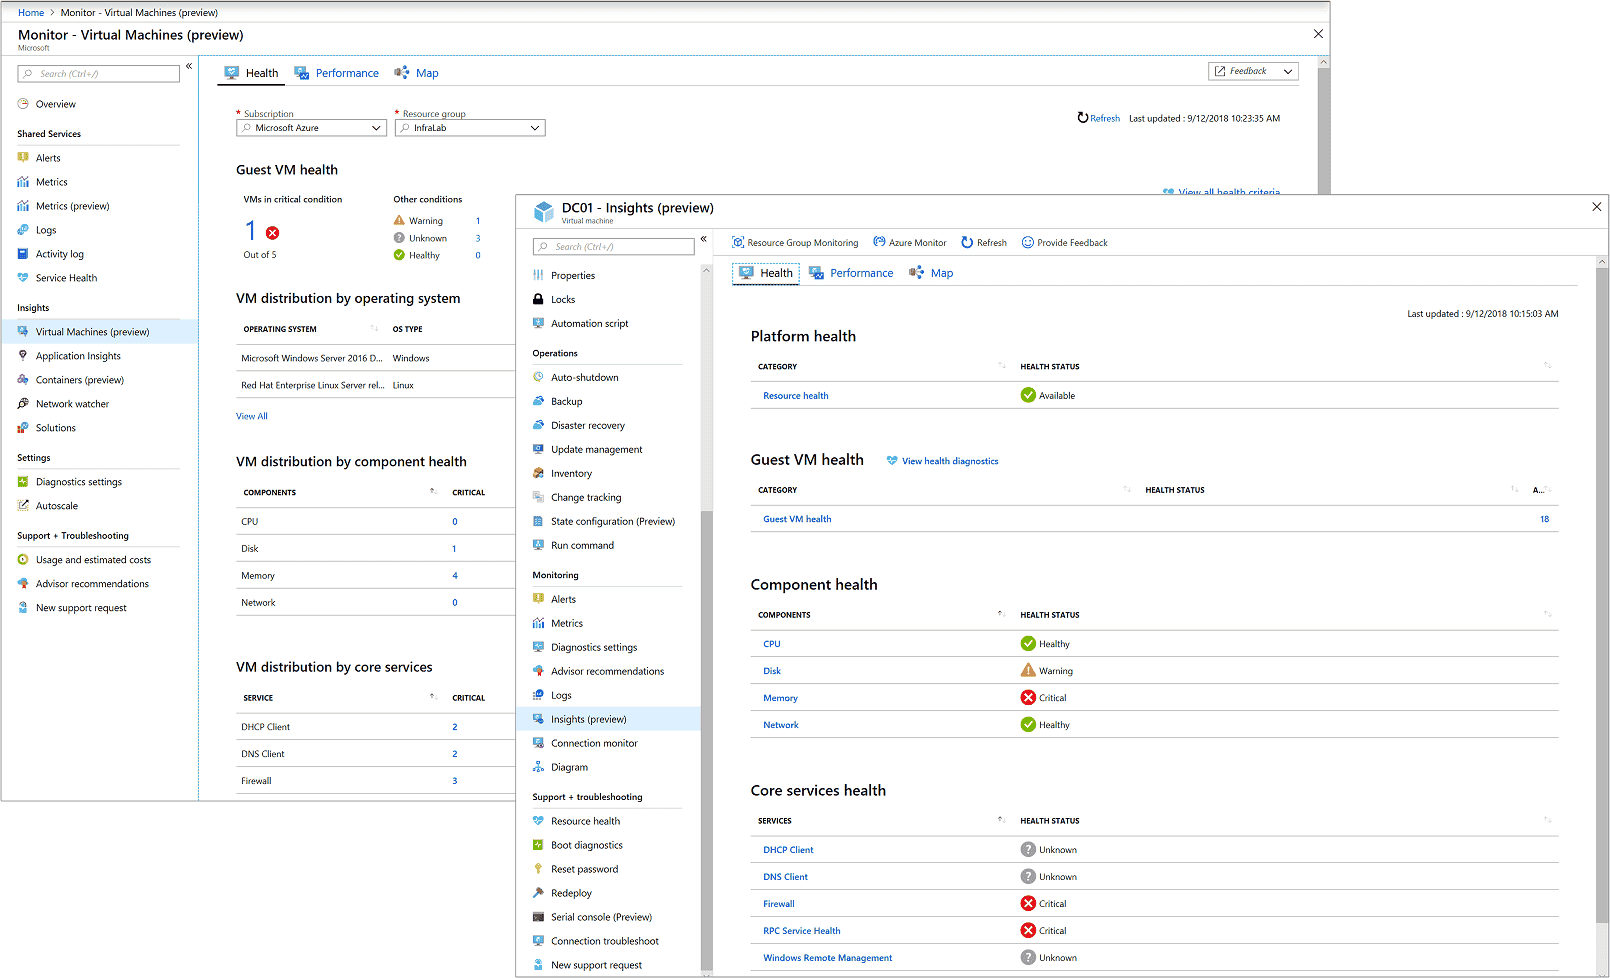
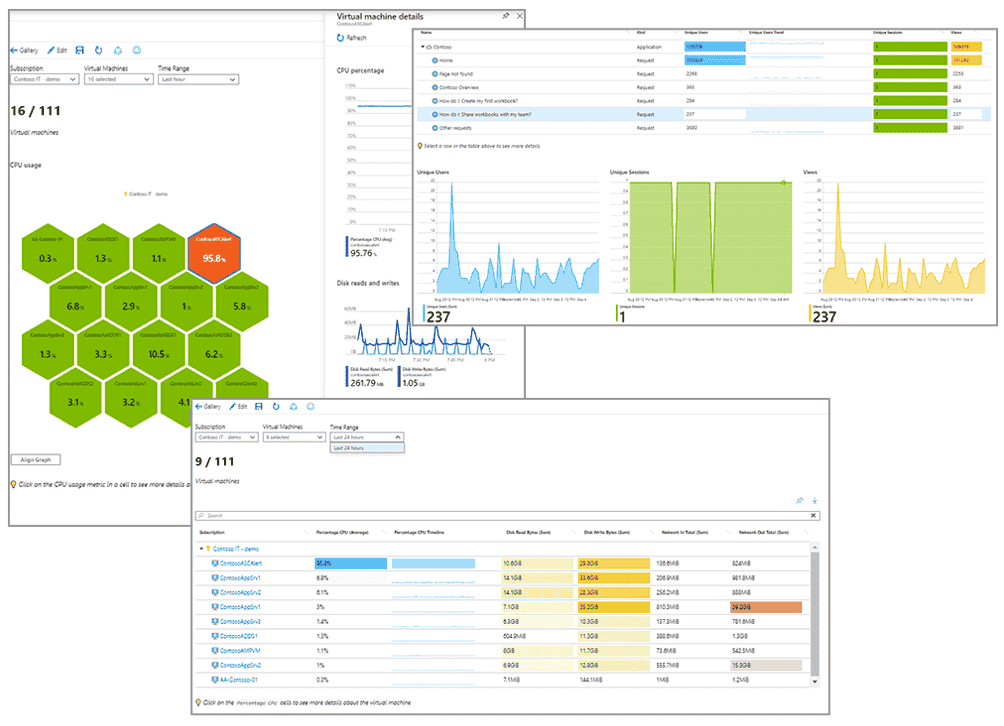
VM Insight
Monitor Performance, health, and running processes of VM and virtual machines scale sets.\
-
Works with: Windows and Linux operating systems
-
Azure VM & VMSS
-
Hybrid virtual machines connected with Azure Arc
-
On-premises VM
-
VM hosted in another cloud environment
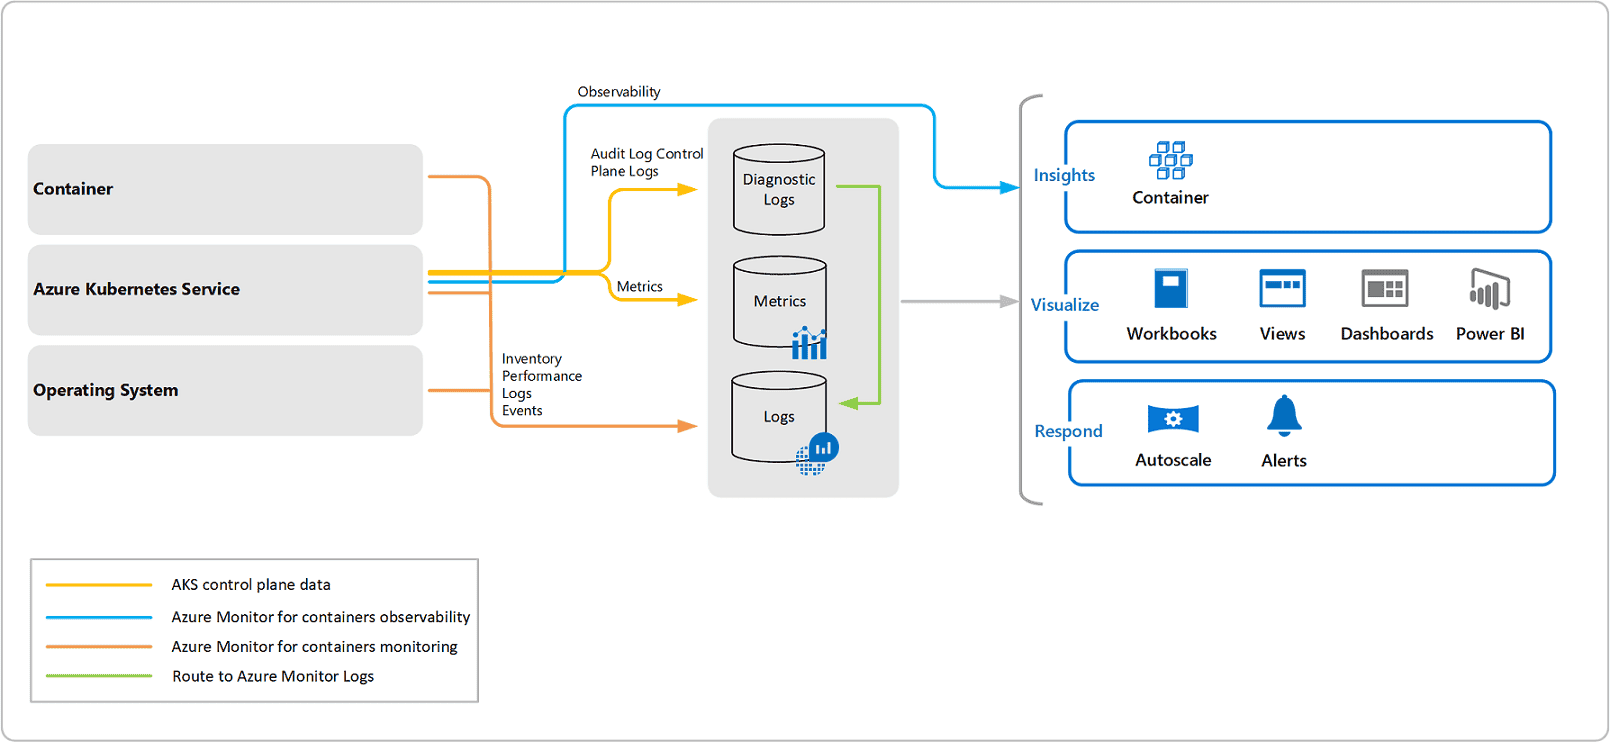
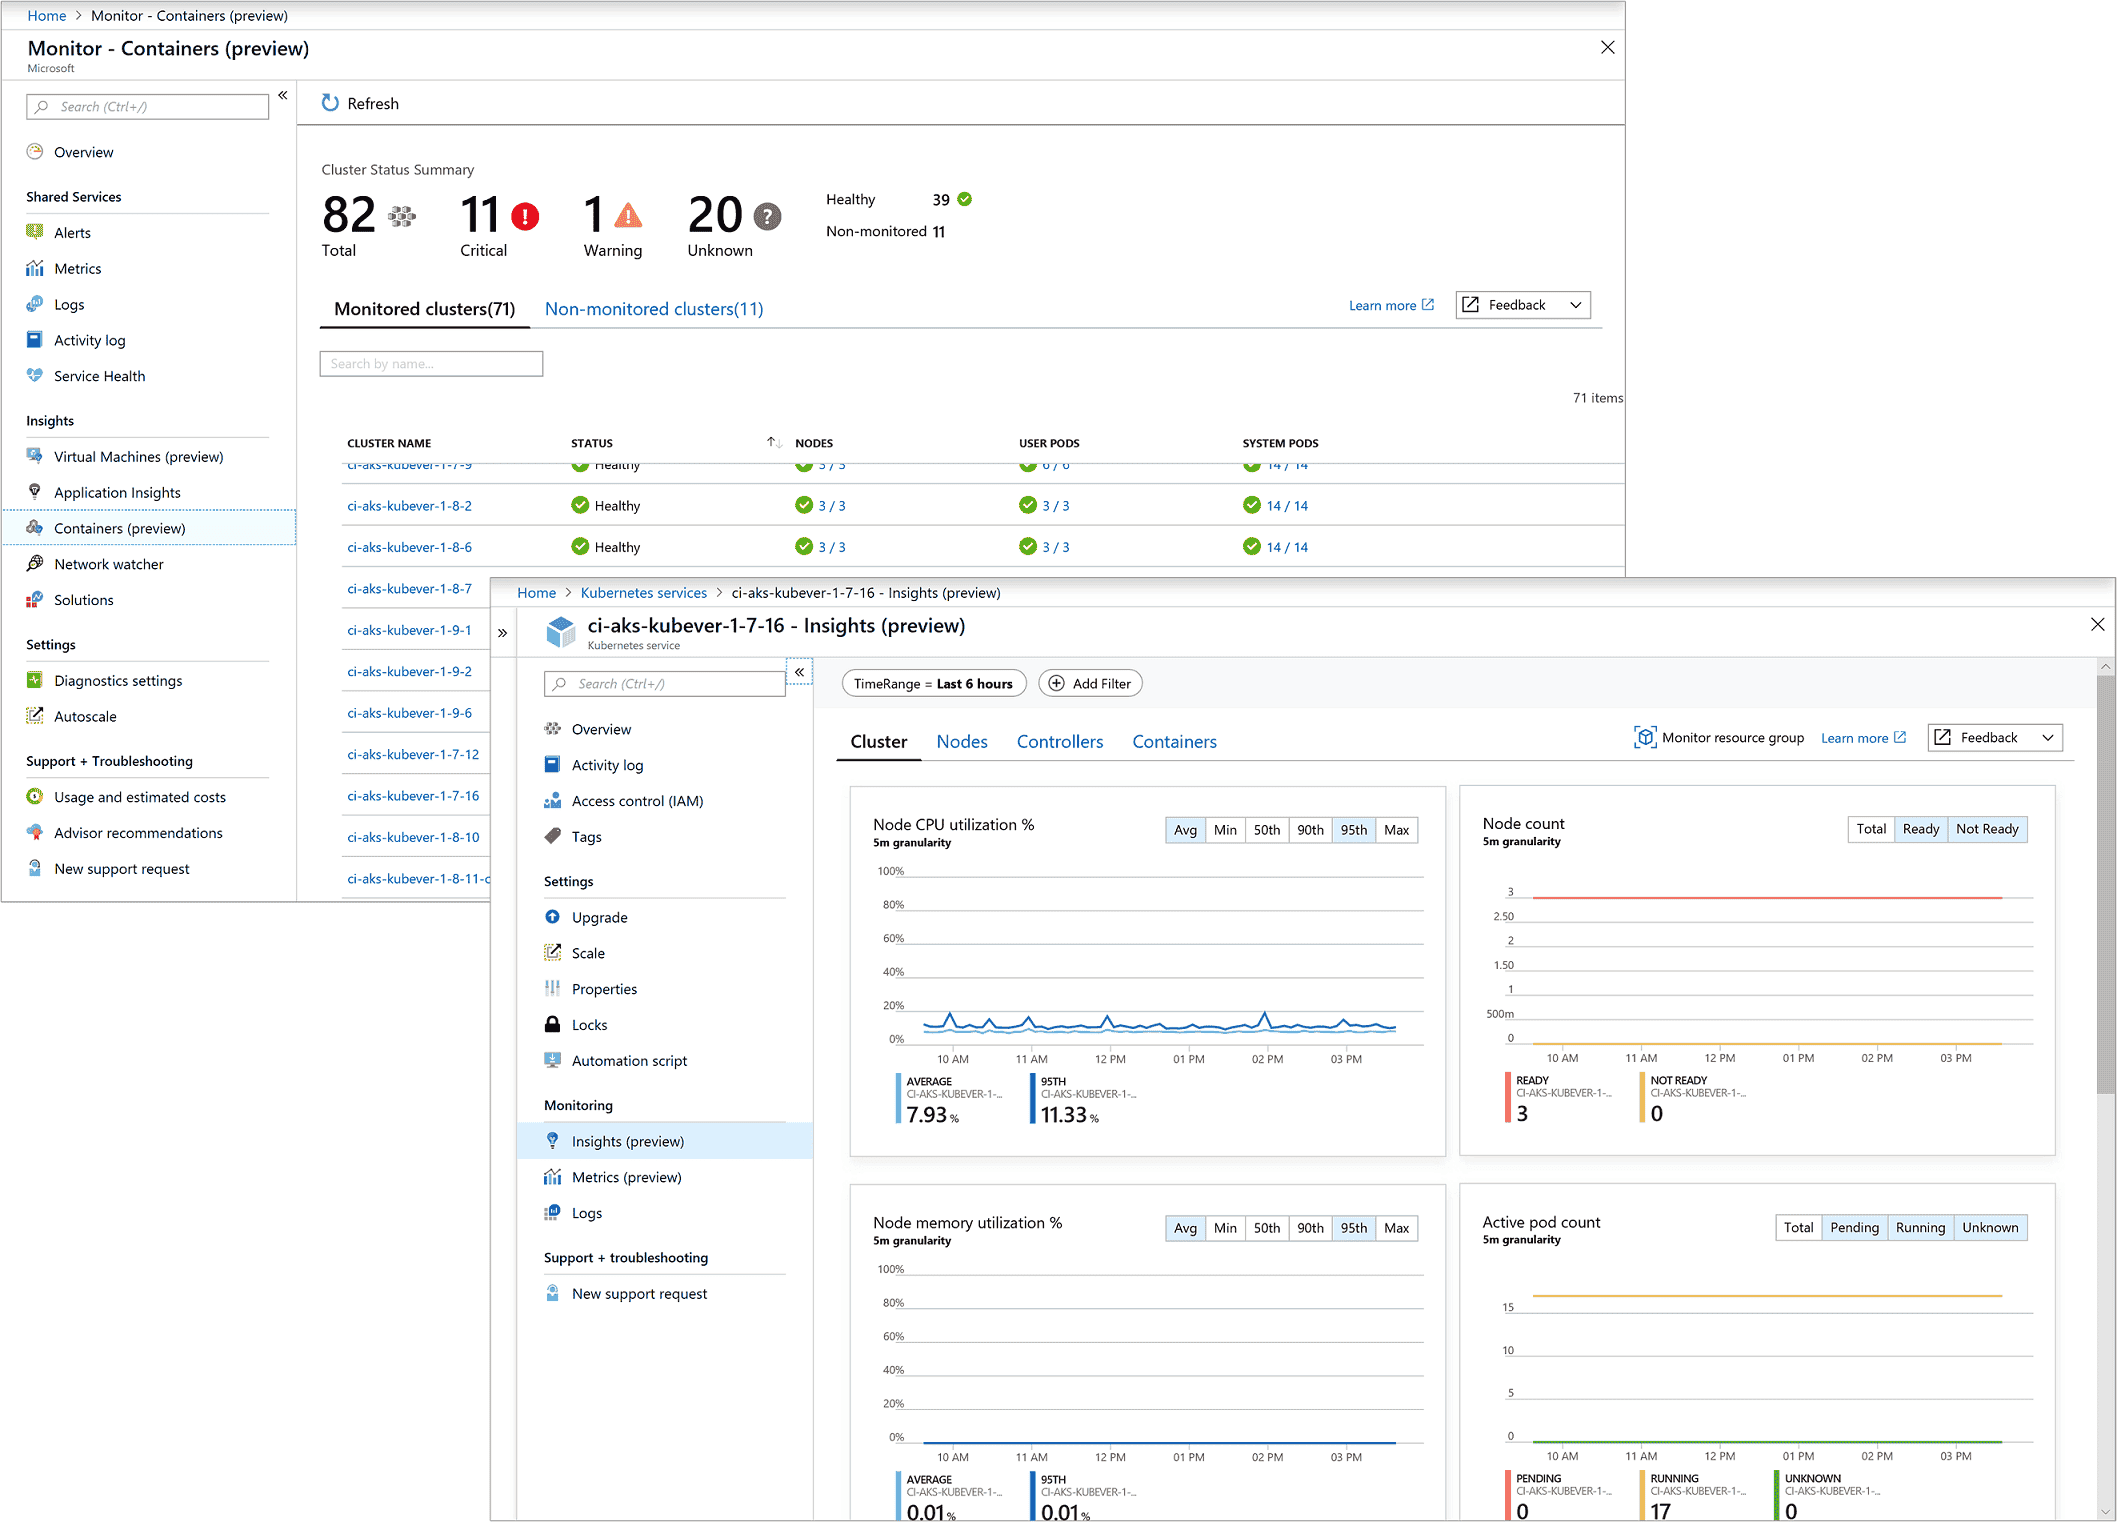
Container Insights
Monitor Performance, health, and utilization of container workloads in Azure Container Instances or clusters hosted on Azure Kubernetes Service.
- Works with performance and health of your Kubernetes cluster running Linux and Windows Server 2019 operating system,
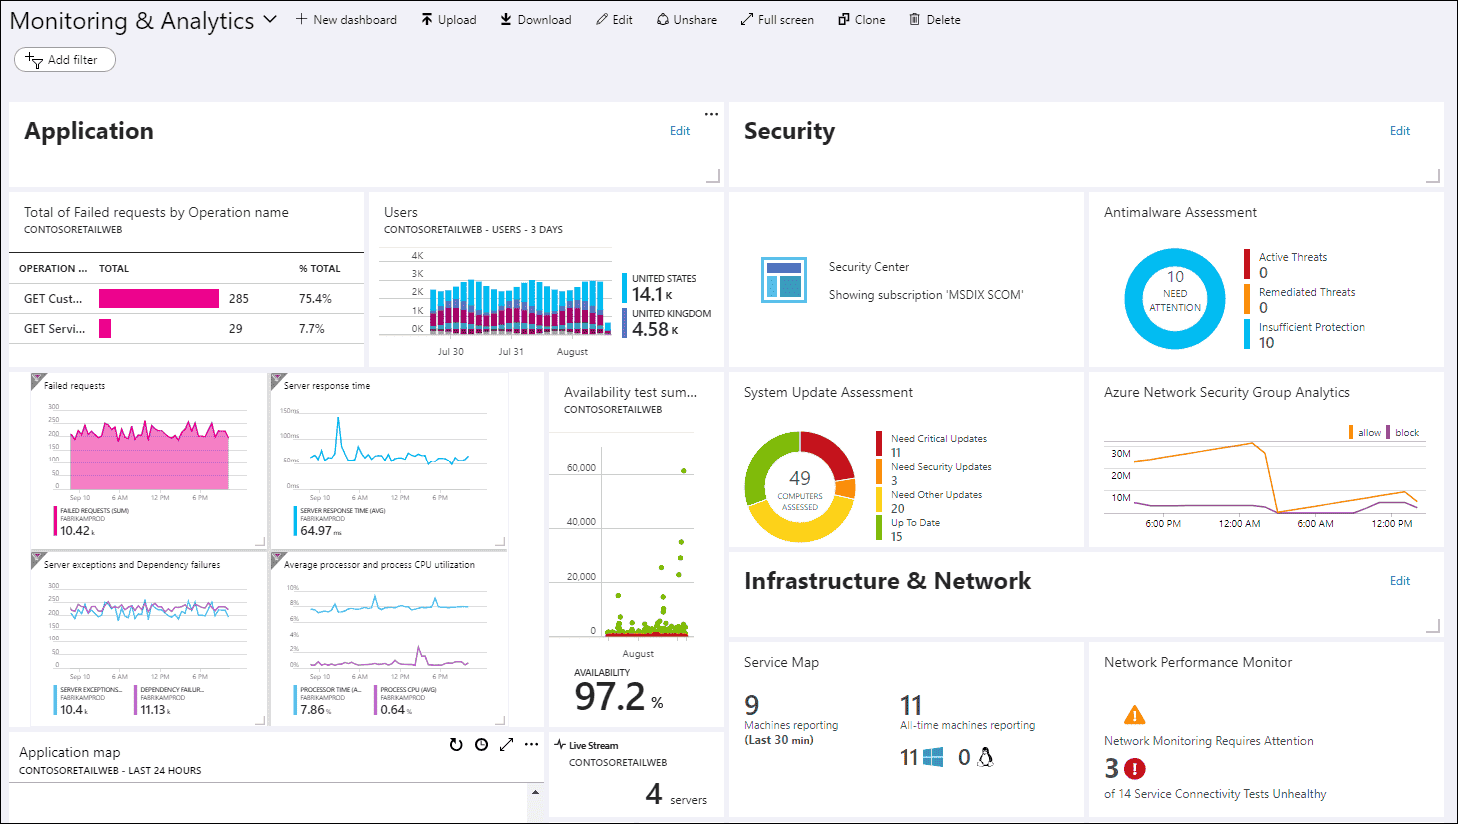
Dashboard
Combine different kinds of data into a single pane in the Azure portal. Y
- Can optionally share the dashboard with other Azure users.
- Add the output of any log query or metrics chart to an Azure dashboard.
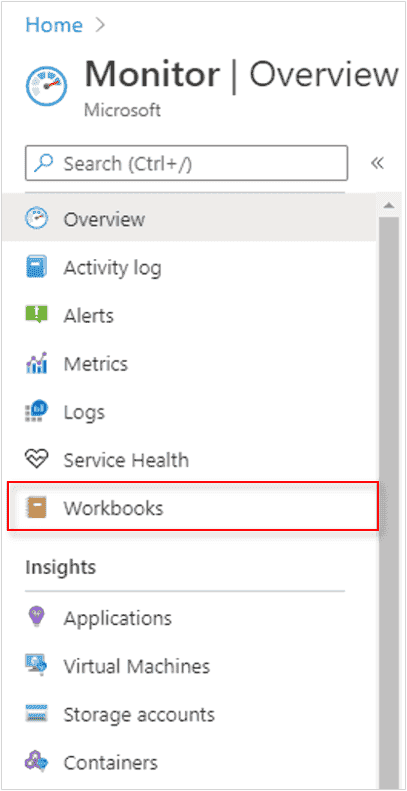
Workbooks
Flexible canvas for data analysis and the creation of rich visual reports within the Azure portal
- Combine multiple data sources from across Azure, and combine them into unified interactive experiences.
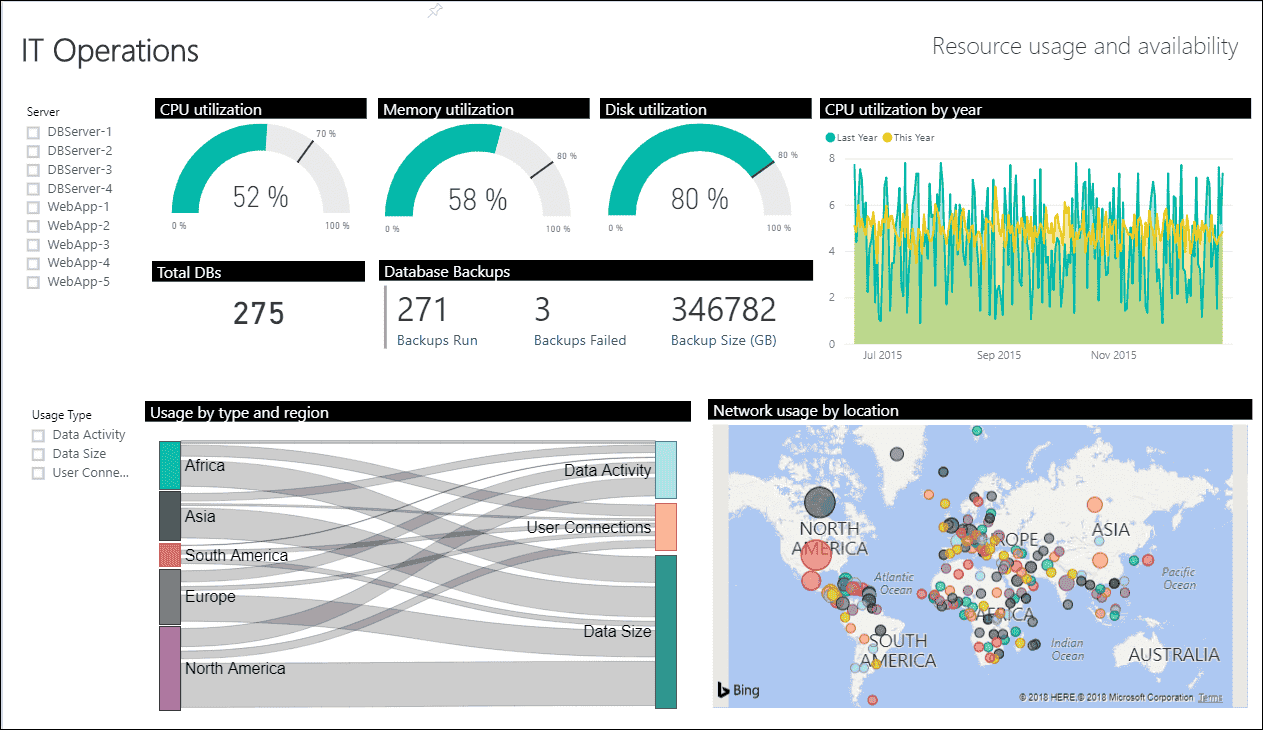
Power BI
Power BI is a business analytics service to provides interactive visualizations across a variety of data sources.
- automatically import log data from Azure Monitor to take advantage of these additional visualizations.
STEP 3: ANALYZE
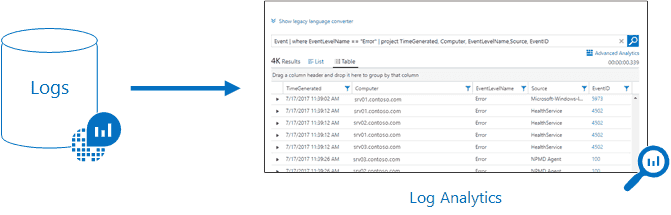
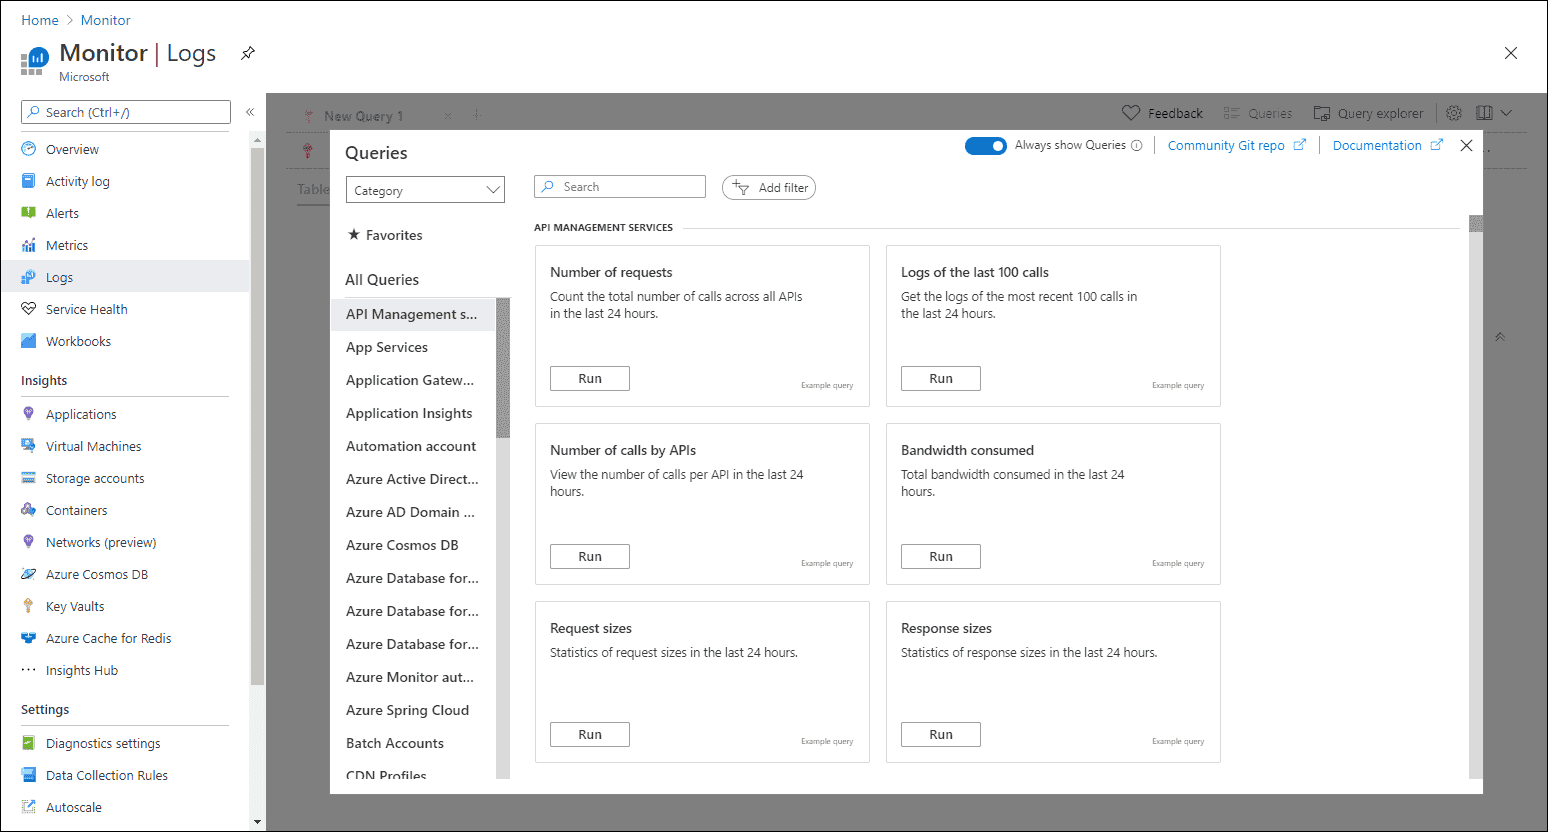
Log Analytics
All log data obtained by Azure Monitor shall be stored in a
Log Analytics workspaceQuery simple to advanced logs.
- The data is retrieved from a workspace using a log query written using
Kusto Query Language (KQL)
The queries that you can run are:
- Table-based queries – the query organizes log data into tables. Search queries – use this query if you need to find a specific value in your table.
- Sort and top – to display the results in a particular order, you must sort the preferred column. To get the latest records in the entire table, you can use top.
- Where – this operator allows you to add a filter to a query. You can use different expressions when writing filter conditions.
- Time filter in query – you can define a specific time range by adding the time filter to the query.
- Project and Extend – project allows you to select specific columns and extend will add additional columns.
- Summarize – you can identify a group of records and apply aggregations using the summarize operator.
Limitations:
- If the query includes workspaces in
20 or more regions, your query will be blocked from running. - Log Analytics results are limited to a
maximum of 10k records.
With a log analytics agent, you can collect logs and performance data from virtual or physical devices outside Azure.
- Log analytics agent cannot send data to Azure Monitor Metrics, Azure Storage, or Azure Event Hubs.
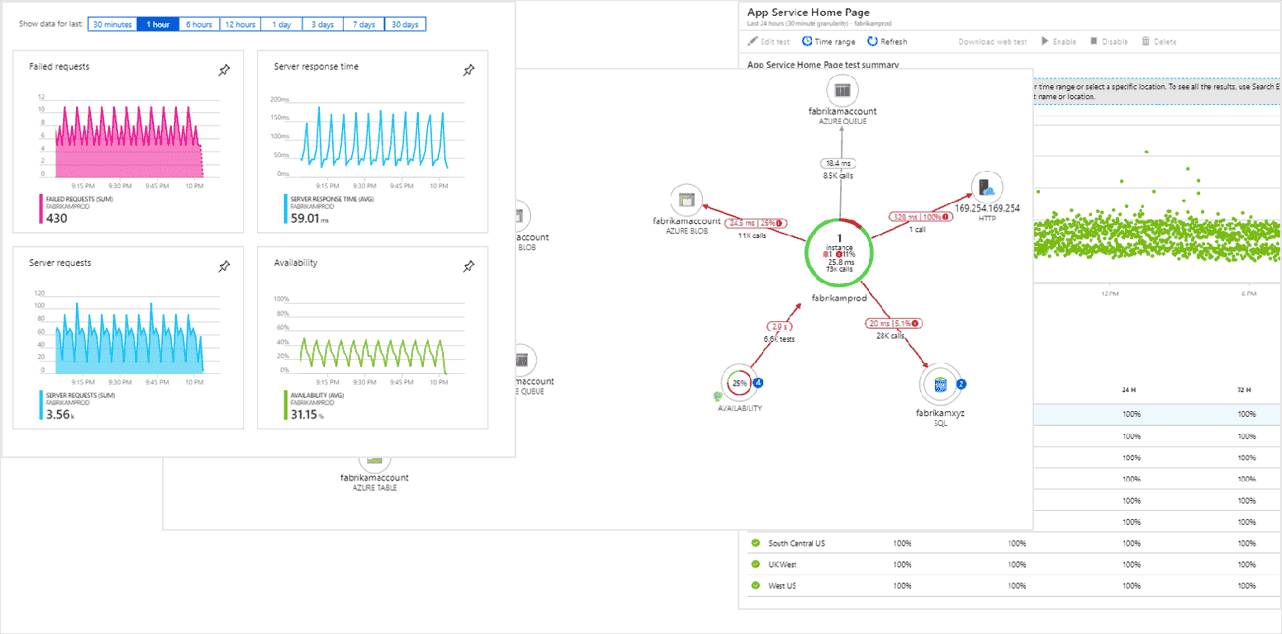
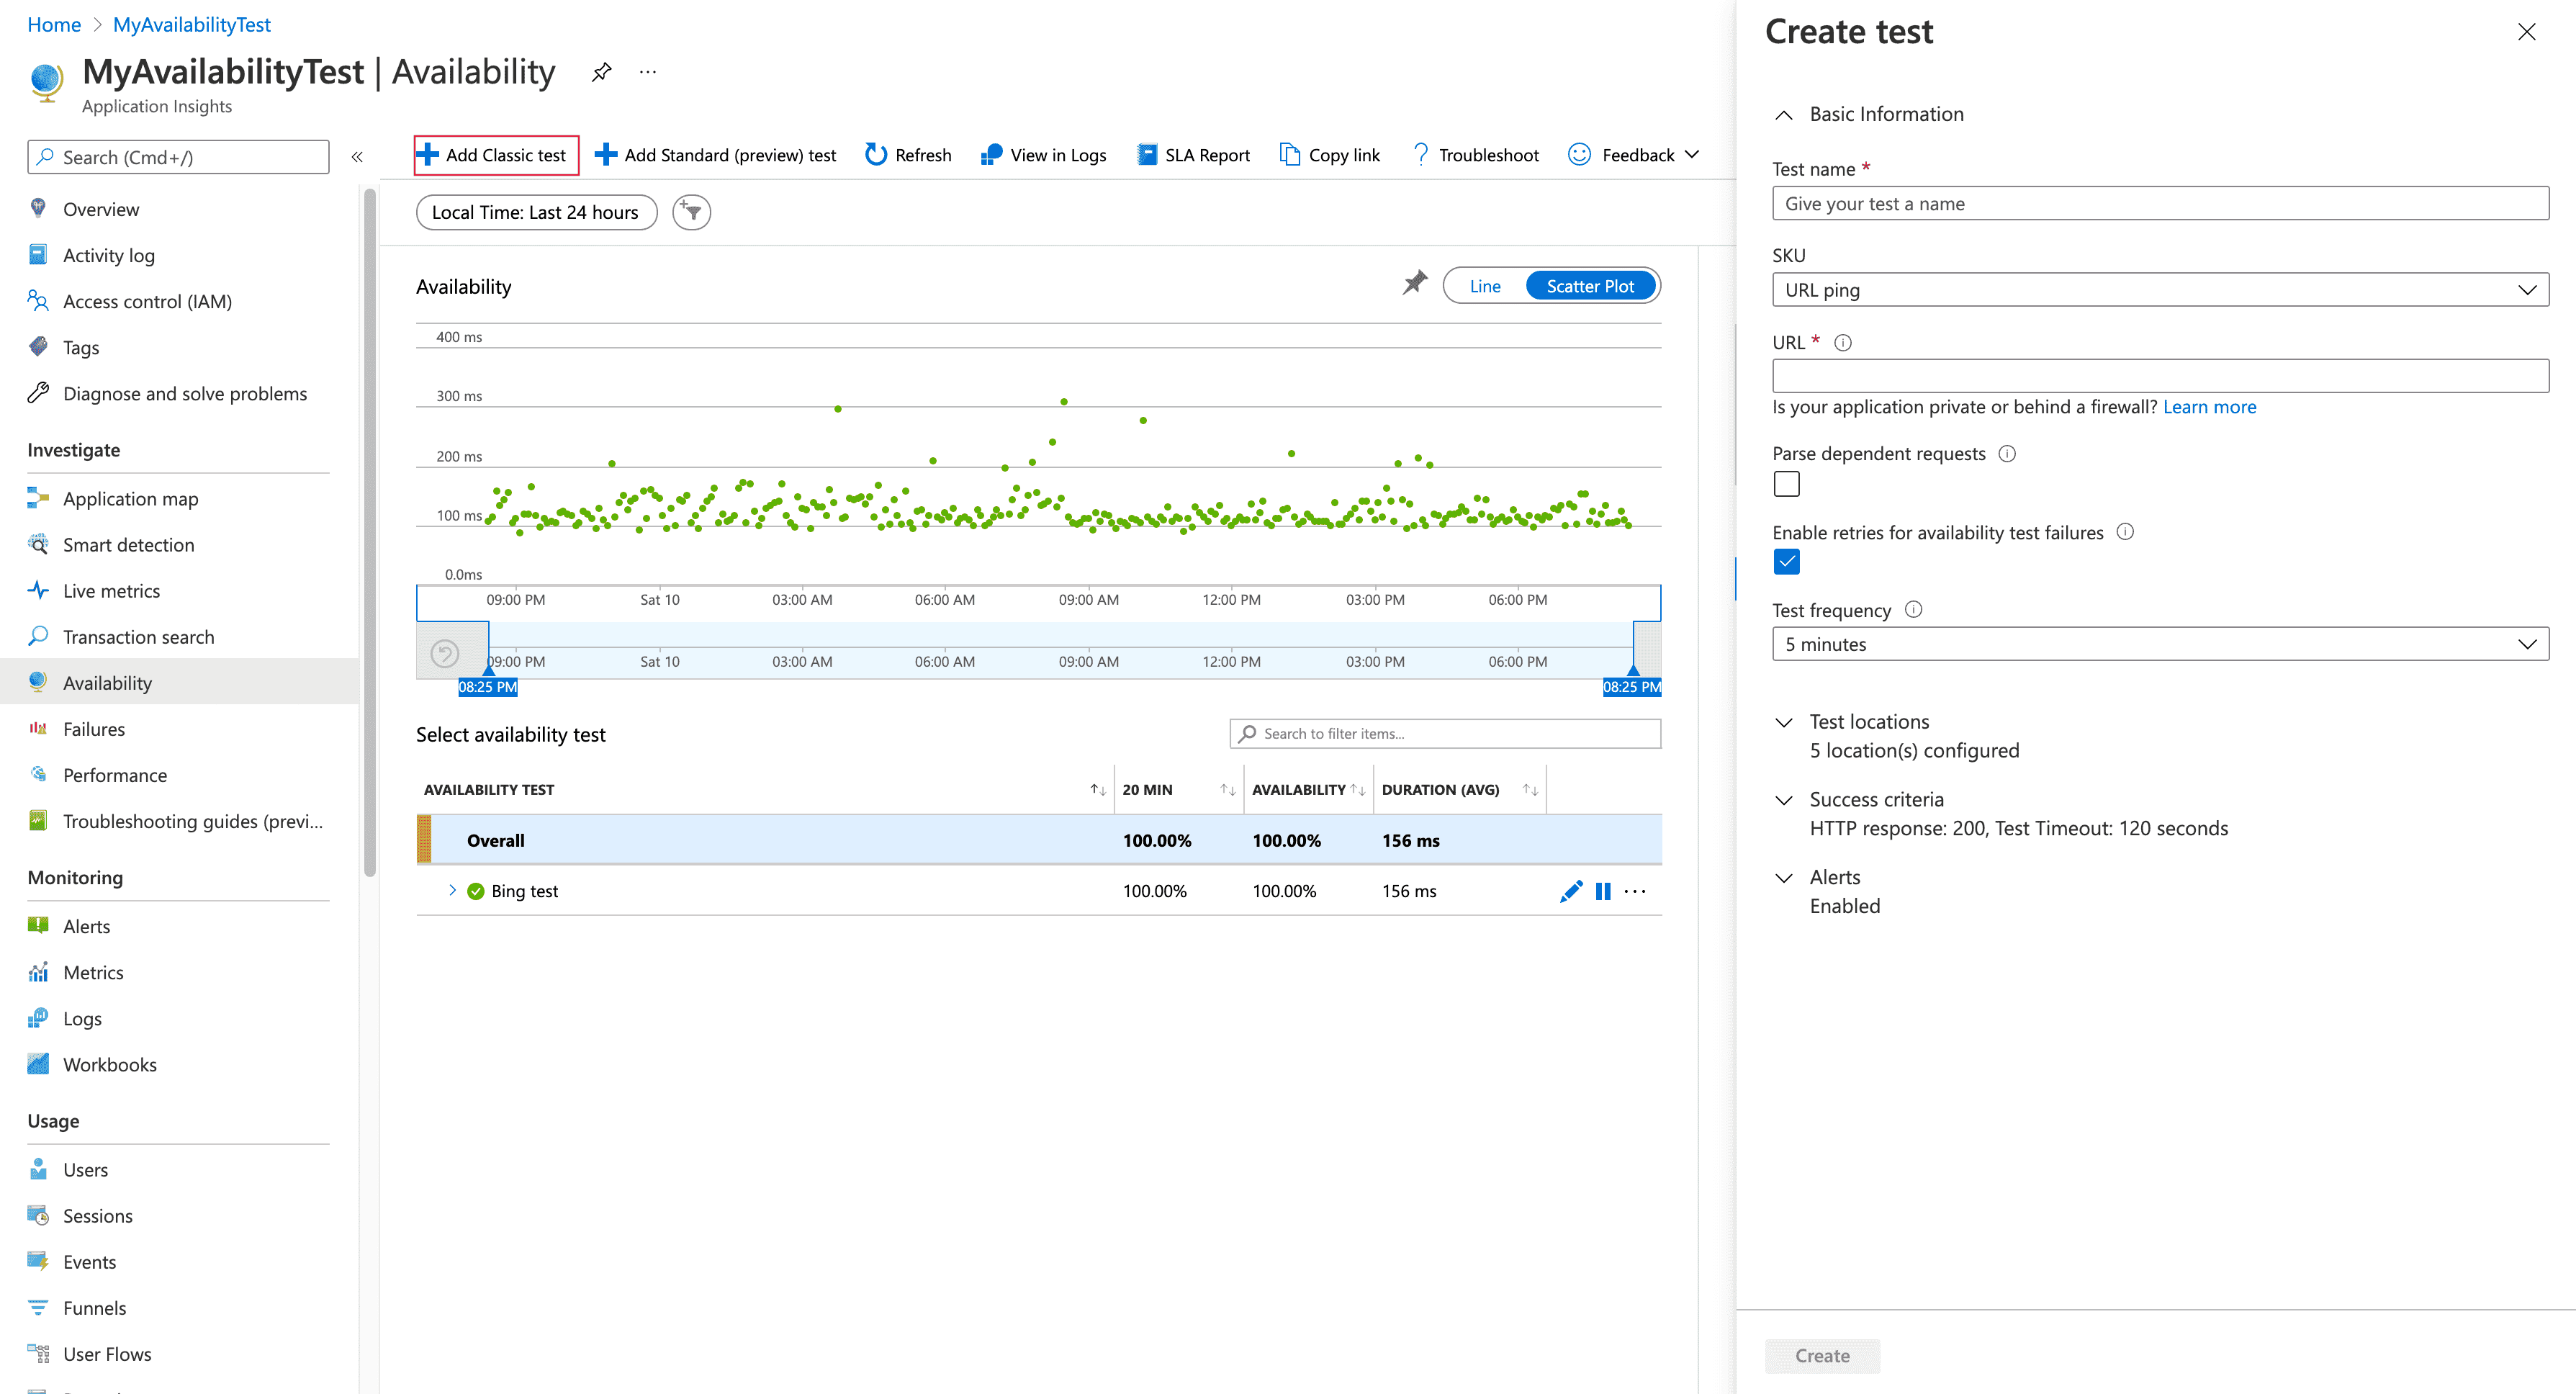
Availability Test
Recurring tests to monitor availability and responsiveness of Web App
- Application Insights sends web requests to your application at regular intervals from points around the world. It can alert you if your application isn't responding or responds too slowly.
- Supports: HTTP/S end point own by self or external end points
Limit: max 100 availability tests / Application Insights resource
Availability Tests Types
1. URL ping test(classic)
ping URL
2. Standard test (Preview)
ping URL + check SSL certificate validity, proactive lifetime check, HTTP request verb (for example GET, HEAD, or POST), custom headers, and custom data associated with your HTTP request.
3. Custom TrackAvailability test
custom application to run availability tests by calling
TrackAvailability()
4. Multi-step web test (classic)
Play back this recording of a sequence of web requests to test more complex scenarios.
- Created in Visual Studio Enterprise and uploaded to the portal, where you can run them.
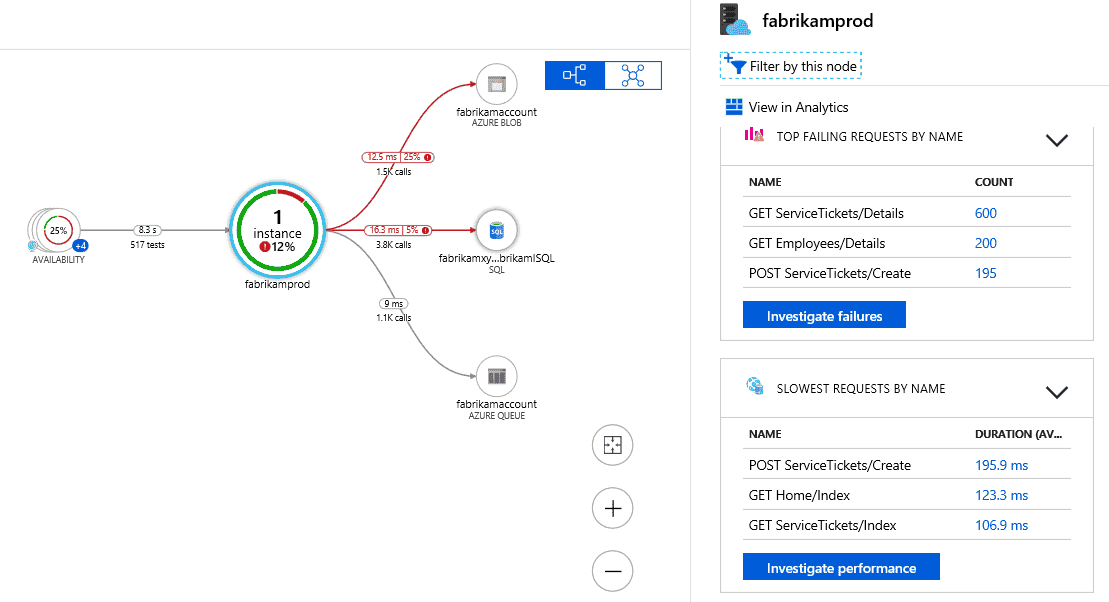
Application Map
Check Performance bottlenecks or failure hotspots across all components of your distributed application.
- Help with troubleshooting of distributed App
Step 4: RESPOND
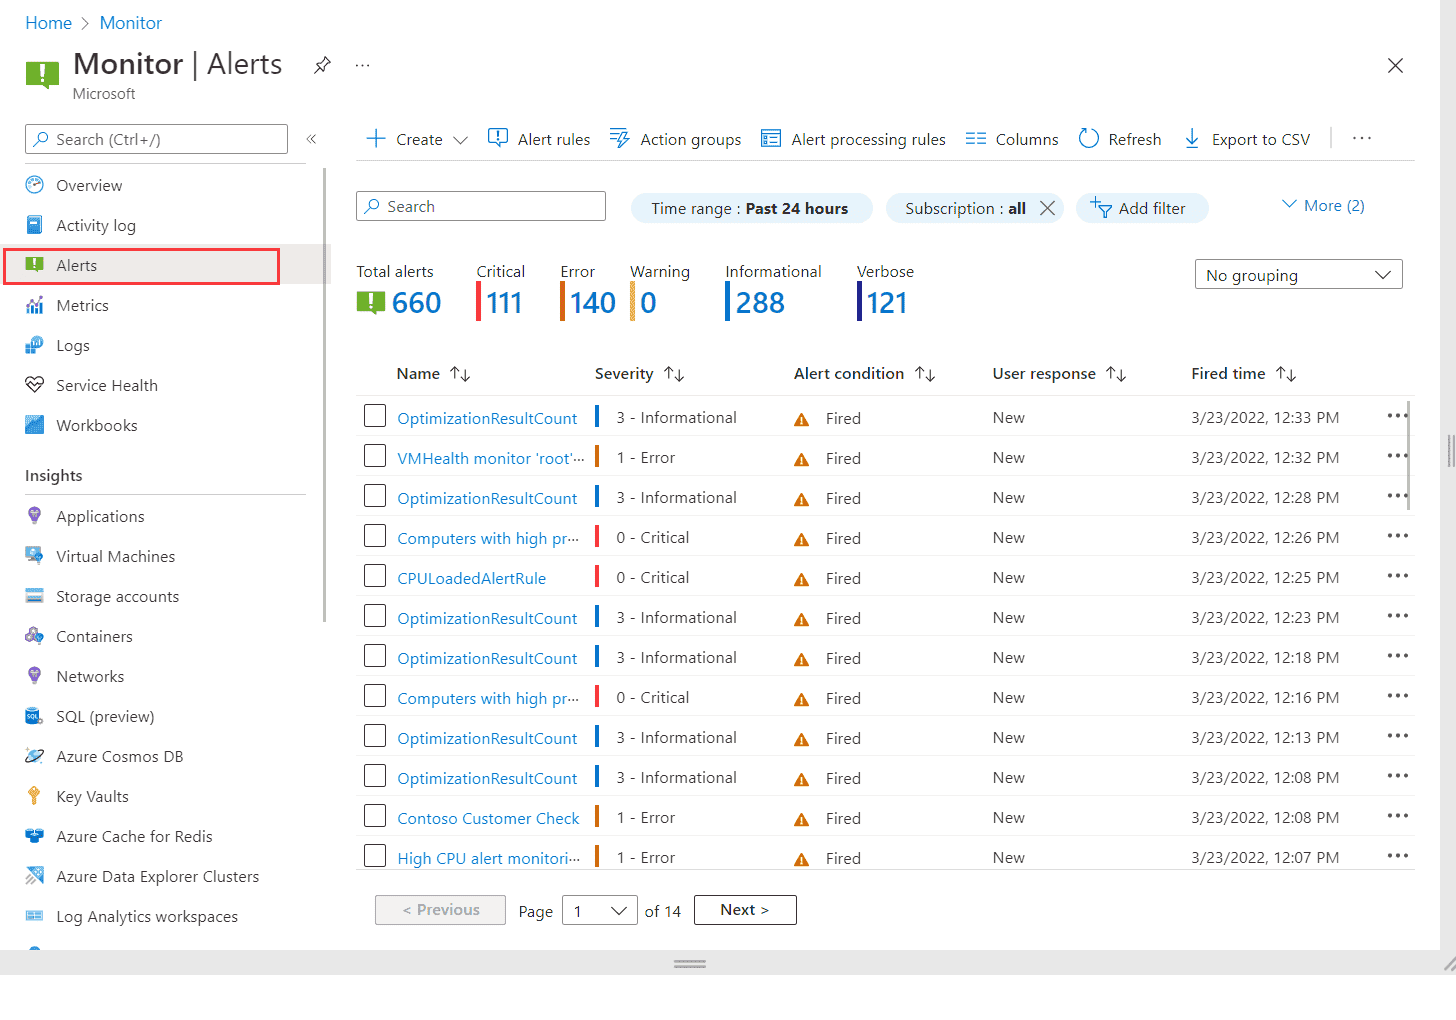
Alert
Identify and address issues before the users of your system notice them.

Target Resource
Defines the scope and signals available for alerting.
A target can be any Azure resource:
- Virtual machines.
- Storage accounts.
- Log Analytics workspace.
- Application Insights.
Signal
Emitted by the target resource.
Signals can be:
- Metric
- Activity log
- Application Insights
- Log.
Criteria
A combination of signal and logic applied on a target resource.
Examples:
- Percentage CPU > 70%
- Server Response Time > 4 ms
- Result count of a log query > 100
Alert Name
A specific name for the alert rule
Alert Description
A description for the alert rule
Severity
The severity of the alert after from 0 to 4.
Sev 0= CriticalSev 1= ErrorSev 2= WarningSev 3= InformationalSev 4= Verbose
Action
A specific action taken when the alert is fired.