NVIDIA DCGM: GPU Health, Diagnostics, and Prometheus Metrics
How NVIDIA's Data Center GPU Manager works — the nv-hostengine daemon, key DCGM metric field IDs, XID error codes and diagnostic levels, the DCGM Exporter DaemonSet and Prometheus integration on Kubernetes, PromQL queries and alert rules for GPU clusters, DCGM-driven KEDA autoscaling, and MIG instance monitoring.
NVIDIA Base Command Manager: Provisioning and Operating GPU Clusters
CI/CD Pipelines: From Commit to Production
NVIDIA DCGM: GPU Health, Diagnostics, and Prometheus Metrics
nvidia-smi answers "what is this one GPU doing right now?" — fine for troubleshooting a single box. NVIDIA Data Center GPU Manager (DCGM) answers the same question at fleet scale: monitoring, diagnostics, and health management across every GPU in a cluster, at the GPU layer inside the OS.
- DCGM Official Guide
What DCGM Does
Provides enterprise-grade monitoring, diagnostics, and health management for NVIDIA GPUs.
At its heart, DCGM is an intelligent, lightweight user space library/agent that performs a variety of functions on each host system:
- GPU behavior monitoring
- GPU configuration management
- GPU policy oversight
- GPU health and diagnostics
- GPU accounting and process statistics
- NVSwitch configuration and monitoring
flowchart
    GPU1[GPU 1 🧮] --> DCGM["Data Center GPU Manager (DCGM) 📶"]
    GPU2[GPU 2 🧮] --> DCGM
    GPU3[GPU 3 🧮] --> DCGM
    GPU4[GPU 4 🧮] --> DCGM

  DCGM -->DCGMExporter["DCGM Exporter ⬆️"]
  DCGMExporter-->Prometheus["Prometheus 🔥"]
  Prometheus--> Grafana["Grafana Dashboard 📊"]
DCGM Dashboard
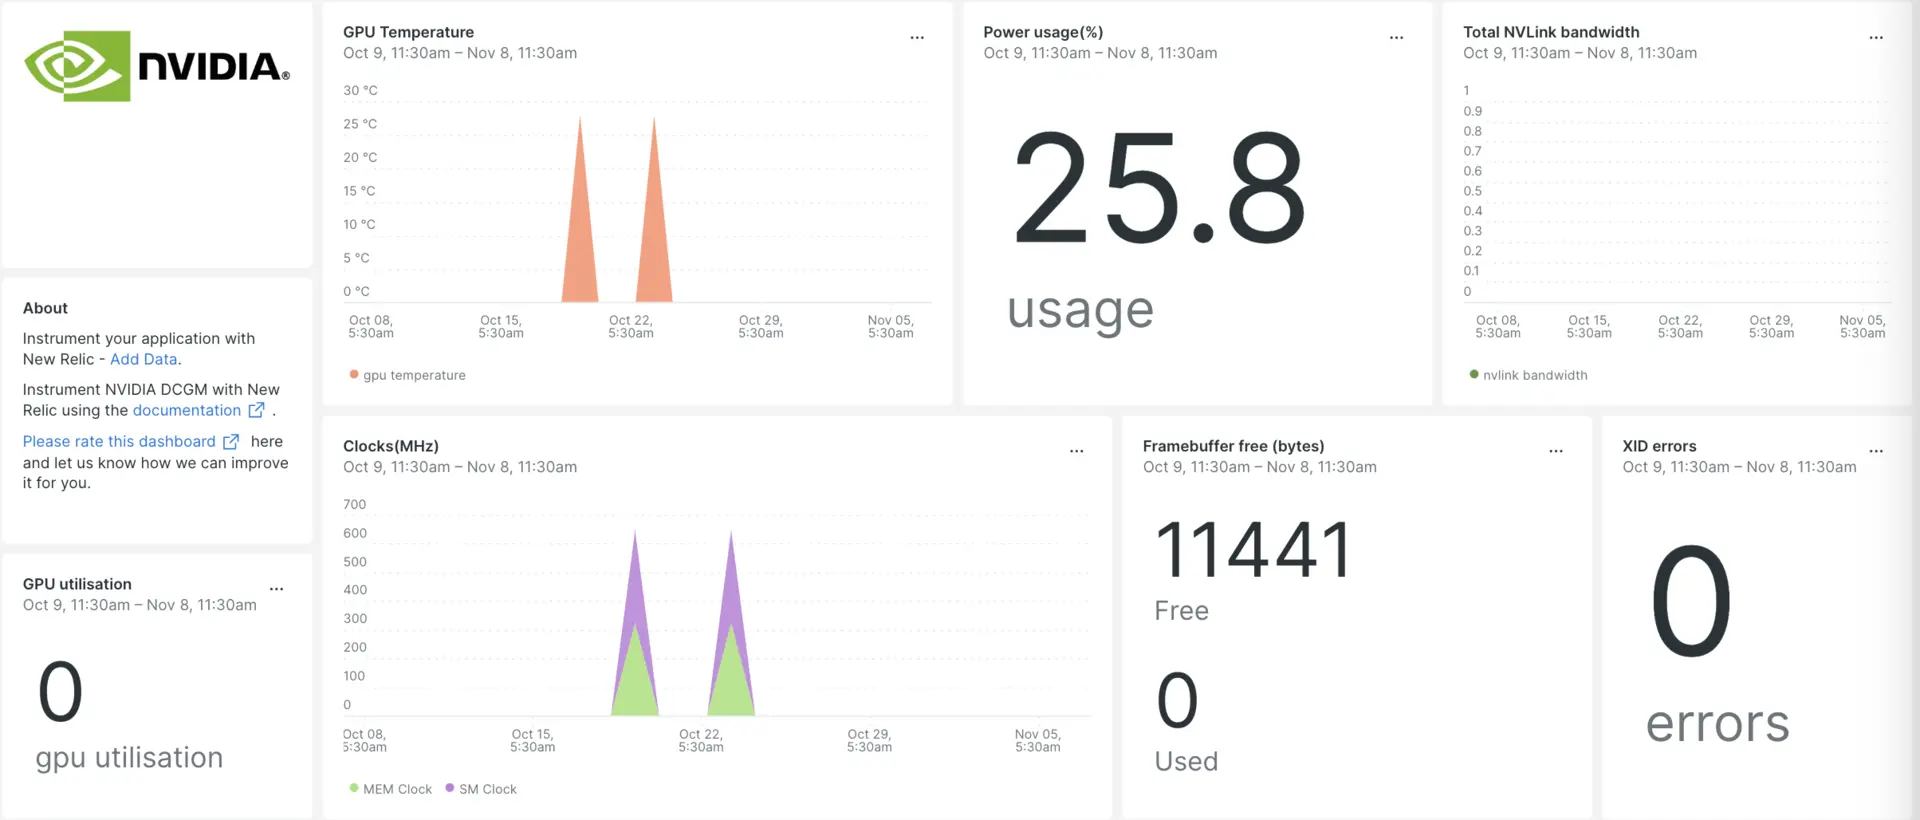
GPU-level monitoring and management:
- GPU health
- Temperature
- Power usage
- Utilization
- ECC errors
- GPU diagnostics
How DCGM Works
DCGM runs as a host-agent daemon (nv-hostengine) on each GPU node.
It communicates with the NVIDIA driver via the NVML library, polls GPU hardware counters at configurable intervals, and exposes them over a local socket that exporters and management tools connect to.
  GPU Hardware Counters (NVML)
          │
          ▼
  nv-hostengine (DCGM daemon — runs on each node)
          │
     ┌────┴──────────────────┐
     ▼                       ▼
  dcgm-exporter          dcgmi CLI
  (HTTP :9400/metrics)   (local diagnostics)
          │
          ▼
    Prometheus scrape
          │
          ▼
    Grafana / AlertManager
Key DCGM Metric Fields
DCGM exposes metrics as field IDs. The most important ones for production GPU clusters:
| Field | Metric Name | What it tells you |
|---|---|---|
| 1001 | DCGM_FI_DEV_GPU_UTIL |
SM utilization % — primary "is the GPU busy?" signal |
| 1003 | DCGM_FI_DEV_MEM_COPY_UTIL |
Memory bandwidth utilization % |
| 1004 | DCGM_FI_DEV_ENC_UTIL |
Video encoder utilization (usually 0 for training) |
| 1005 | DCGM_FI_DEV_DEC_UTIL |
Video decoder utilization |
| 1002 | DCGM_FI_DEV_GPU_TEMP |
GPU die temperature (°C) — alert > 83°C on H100 |
| 155 | DCGM_FI_DEV_POWER_USAGE |
Real-time power draw (W) — H100 TDP = 700 W |
| 100 | DCGM_FI_DEV_FB_FREE |
Free framebuffer (VRAM) in MB |
| 101 | DCGM_FI_DEV_FB_USED |
Used VRAM in MB |
| 252 | DCGM_FI_DEV_ECC_SBE_VOL_TOTAL |
Single-bit ECC errors (corrected) — trend matters |
| 253 | DCGM_FI_DEV_ECC_DBE_VOL_TOTAL |
Double-bit ECC errors (uncorrectable) — alert immediately |
| 409 | DCGM_FI_DEV_NVLINK_BANDWIDTH_TOTAL |
NVLink aggregate bandwidth (GB/s) |
| 1009 | DCGM_FI_DEV_PCIE_REPLAY_COUNTER |
PCIe replay errors — indicates bad cable/slot |
| 230 | DCGM_FI_DEV_XID_ERRORS |
XID error count — the single most critical health signal |
| 203 | DCGM_FI_DEV_SM_CLOCK |
SM (shader/compute) clock frequency (MHz) |
| 156 | DCGM_FI_DEV_TOTAL_ENERGY_CONSUMPTION |
Cumulative energy in mJ |
XID (eXternal Interface Daemon) Errors
XID errors are NVIDIA's GPU error codes, written to the kernel log (
dmesg).
DCGM tracks them as DCGM_FI_DEV_XID_ERRORS.
The ones that matter in production:
| XID | Meaning | Action |
|---|---|---|
| 8 | GPU stopped processing | Job stalled; kill and reschedule |
| 31 | GPU memory page fault | Application bug or hardware fault |
| 48 | Double-bit ECC error (DBE) | Hardware fault — GPU needs RMA |
| 56 | Display engine error | Usually benign on headless servers |
| 63 | Row remapping pending/failure | VRAM degradation — monitor, plan RMA |
| 74 | NVLink error | Check NVLink cables and topology |
| 79 | GPU reset required | Hang; DCGM will trigger reset |
| 92 | High severity XID | Immediate investigation required |
| 94 | Contained ECC error | GPU isolated the fault — check health |
| 95 | Uncontained ECC error | Workload must be migrated immediately |
Checking XID Errors
# Check XID errors in kernel log
dmesg | grep -i "NVRM.*XID"

# DCGM CLI — check health
dcgmi health -g 0 -j         # group 0, JSON output

# Run diagnostics
dcgmi diag -r 1              # short (< 2 min)
dcgmi diag -r 2              # medium (~5 min)
dcgmi diag -r 3              # long (production validation, ~20 min)
DCGM Diagnostic Levels
| Level | Duration | What it tests |
|---|---|---|
| 1 — Short | < 2 min | Software/config, basic GPU health, PCIe bandwidth |
| 2 — Medium | ~5 min | Memory stress test, compute TFLOPS baseline |
| 3 — Long | ~20 min | Full memory scrub, sustained compute, NVLink stress, PCIe stress |
Run level 3 after physical hardware moves or before a GPU is declared production-ready.
DCGM on Kubernetes
DCGM exposes metrics through DCGM Exporter.
Used by:
- Prometheus (via DCGM exporter)
- Cluster monitoring systems
The GPU Operator (deployed once per cluster) automatically bundles:
- DCGM
- DCGM Exporter
If you installed the GPU Operator, DCGM is already running.
GPU Operator
    ├── gpu-driver            DaemonSet — install NVIDIA drivers
    ├── nvidia-device-plugin  DaemonSet — advertise nvidia.com/gpu resources
    ├── dcgm                  DaemonSet — nv-hostengine on each GPU node
    ├── dcgm-exporter         DaemonSet — Prometheus metrics on :9400/metrics
    ├── gpu-feature-discovery DaemonSet — node labels (gpu.nvidia.com/*)
    └── node-status-exporter  DaemonSet — node-level health
DCGM Exporter DaemonSet (standalone, without GPU Operator)
apiVersion: apps/v1
kind: DaemonSet
metadata:
  name: dcgm-exporter
  namespace: monitoring
spec:
  selector:
    matchLabels:
      app: dcgm-exporter
  template:
    metadata:
      labels:
        app: dcgm-exporter
      annotations:
        prometheus.io/scrape: "true"
        prometheus.io/port:   "9400"
    spec:
      nodeSelector:
        nvidia.com/gpu.present: "true"     # only GPU nodes
      tolerations:
        - key: nvidia.com/gpu
          operator: Exists
          effect: NoSchedule
      containers:
        - name: dcgm-exporter
          image: nvcr.io/nvidia/k8s/dcgm-exporter:3.3.0-3.2.0-ubuntu22.04
          ports:
            - containerPort: 9400
          env:
            - name: DCGM_EXPORTER_KUBERNETES
              value: "true"               # enrich metrics with pod/namespace labels
          securityContext:
            privileged: true             # required to access NVML
          volumeMounts:
            - name: nvidia-install-dir-host
              mountPath: /usr/local/nvidia
      volumes:
        - name: nvidia-install-dir-host
          hostPath:
            path: /usr/local/nvidia
Prometheus ServiceMonitor
apiVersion: monitoring.coreos.com/v1
kind: ServiceMonitor
metadata:
  name: dcgm-exporter
  namespace: monitoring
spec:
  selector:
    matchLabels:
      app: dcgm-exporter
  endpoints:
    - port: metrics
      interval: 15s          # scrape every 15s — fine for GPU metrics
      path: /metrics
When DCGM_EXPORTER_KUBERNETES=true, each metric is enriched with pod-level labels:
DCGM_FI_DEV_GPU_UTIL{
  gpu="0",
  UUID="GPU-abc123",
  node="dgx-node-01",
  namespace="training",
  pod="llama3-training-worker-0",
  container="pytorch"
} 94.5
This lets you correlate GPU utilization directly with the workload consuming it.
PromQL for GPU Clusters
# Average GPU utilization across the entire cluster
avg(DCGM_FI_DEV_GPU_UTIL) by (node)

# GPUs above 90% utilization (busy nodes)
count(DCGM_FI_DEV_GPU_UTIL > 90)

# GPUs sitting idle (< 10% util) — wasted capacity
DCGM_FI_DEV_GPU_UTIL < 10

# GPU memory utilization %
DCGM_FI_DEV_FB_USED / (DCGM_FI_DEV_FB_USED + DCGM_FI_DEV_FB_FREE) * 100

# GPUs running hot (> 80°C) — pre-throttle warning
DCGM_FI_DEV_GPU_TEMP > 80

# Any GPU with uncorrectable ECC errors right now
DCGM_FI_DEV_ECC_DBE_VOL_TOTAL > 0

# XID error rate per minute (spikes indicate hardware issues)
rate(DCGM_FI_DEV_XID_ERRORS[5m]) > 0

# Power draw per GPU vs TDP (H100 = 700W)
DCGM_FI_DEV_POWER_USAGE

# NVLink bandwidth (should be near 900 GB/s on H100 NVLink 4.0)
DCGM_FI_DEV_NVLINK_BANDWIDTH_TOTAL
Prometheus Alert Rules for GPU Clusters
apiVersion: monitoring.coreos.com/v1
kind: PrometheusRule
metadata:
  name: gpu-alerts
  namespace: monitoring
spec:
  groups:
    - name: gpu.rules
      rules:
        - alert: GPUHighTemperature
          expr: DCGM_FI_DEV_GPU_TEMP > 83
          for: 2m
          labels:
            severity: warning
          annotations:
            summary: "GPU {{ $labels.gpu }} on {{ $labels.node }} is {{ $value }}°C"
            description: "H100 thermal throttle begins at ~83°C. Check cooling."

        - alert: GPUUncorrectableECCError
          expr: DCGM_FI_DEV_ECC_DBE_VOL_TOTAL > 0
          for: 0m
          labels:
            severity: critical
          annotations:
            summary: "Uncorrectable ECC error on {{ $labels.node }} GPU {{ $labels.gpu }}"
            description: "Double-bit ECC errors are uncorrectable. GPU may need RMA."

        - alert: GPUXIDError
          expr: rate(DCGM_FI_DEV_XID_ERRORS[5m]) > 0
          for: 1m
          labels:
            severity: warning
          annotations:
            summary: "XID error on {{ $labels.node }} GPU {{ $labels.gpu }}"
            description: "Check dmesg for XID code. XID 79 = reset, XID 48/94/95 = ECC fault."

        - alert: GPUIdleDuringTraining
          expr: DCGM_FI_DEV_GPU_UTIL{namespace="training"} < 10
          for: 10m
          labels:
            severity: warning
          annotations:
            summary: "Training GPU idle on {{ $labels.node }}"
            description: "GPU < 10% util for 10m during a training job. Storage/network bottleneck?"

        - alert: GPUMemoryNearFull
          expr: |
            DCGM_FI_DEV_FB_USED /
            (DCGM_FI_DEV_FB_USED + DCGM_FI_DEV_FB_FREE) * 100 > 95
          for: 5m
          labels:
            severity: warning
          annotations:
            summary: "GPU VRAM > 95% on {{ $labels.node }}"
DCGM + KEDA: Metric-Driven Autoscaling
DCGM metrics flow into KEDA to autoscale inference deployments based on actual GPU load:
  apiVersion: keda.sh/v1alpha1
  kind: ScaledObject
  metadata:
    name: nim-gpu-scaler
    namespace: inference
  spec:
    scaleTargetRef:
      name: nim-llama3-deployment
    minReplicaCount: 1
    maxReplicaCount: 8
    triggers:
      - type: prometheus
        metadata:
          serverAddress: http://prometheus.monitoring:9090
          metricName: dcgm_gpu_utilization
          # Scale up when average GPU util across inference pods > 70%
          query: |
            avg(DCGM_FI_DEV_GPU_UTIL{namespace="inference"})
          threshold: "70"
This closes the loop: DCGM → dcgm-exporter → Prometheus → KEDA → scale NIM replicas.
MIG Monitoring with DCGM
When GPUs are partitioned with MIG (Multi-Instance GPU), DCGM tracks each MIG instance independently:
# List MIG instances
nvidia-smi mig -lgip

# DCGM auto-discovers MIG instances — metrics appear with gpu_i_id label
DCGM_FI_DEV_GPU_UTIL{gpu="0", gpu_i_id="0", gpu_i_profile="1g.10gb"} 45.2
DCGM_FI_DEV_GPU_UTIL{gpu="0", gpu_i_id="1", gpu_i_profile="1g.10gb"} 78.9
Each MIG slice appears as a separate target in Prometheus, so you can alert on individual partitions and identify which tenant is overloading their slice.
Key Takeaways
| Concept | Summary |
|---|---|
| nv-hostengine | The DCGM daemon running on each GPU node, polling NVML hardware counters |
| Field IDs | DCGM's metric namespace (DCGM_FI_DEV_*) — utilization, temperature, power, ECC, NVLink bandwidth |
| XID errors | NVIDIA's GPU error codes in dmesg; DCGM tracks them as a first-class metric for alerting |
| Diagnostic levels | dcgmi diag -r 1/2/3 — short/medium/long validation, run level 3 after hardware moves |
| DCGM Exporter | Exposes DCGM metrics on :9400/metrics for Prometheus; bundled automatically by the GPU Operator |
| Pod-level enrichment | DCGM_EXPORTER_KUBERNETES=true attaches namespace/pod/container labels to every metric |
| DCGM + KEDA | Prometheus-scraped DCGM utilization drives autoscaling decisions for GPU inference deployments |
| MIG monitoring | Each MIG slice reports independently via gpu_i_id, so per-tenant overload is visible |
DCGM is what turns "GPU utilization" from a number you check by SSHing into a box into a first-class Prometheus metric — the same signal that feeds dashboards, pages an on-call engineer for an uncorrectable ECC error, and drives KEDA to scale an inference deployment, all from the same
nv-hostenginedaemon polling NVML underneath.
Related Posts
- AI/ML Operations & GPU Observability — where DCGM fits alongside SMI and NVIDIA Base Command Manager in the broader GPU monitoring stack
- GPU Scheduling on Kubernetes — how the GPU Operator (which bundles DCGM) is deployed, and how
nvidia.com/gpuresources are advertised to the scheduler - GPU Autoscaling: KEDA, HPA, and Cluster Autoscaler — the full KEDA ScaledObject pipeline consuming these DCGM metrics
- Kubernetes Observability — cluster-level observability (kube-state-metrics, node-exporter) that complements GPU-level DCGM metrics
- HPC at Scale on Kubernetes — multi-node training where DCGM health checks are critical before launching distributed jobs
- NCCL: GPU Communication — NVLink bandwidth metrics (
DCGM_FI_DEV_NVLINK_BANDWIDTH_TOTAL) tell you whether NCCL all-reduce is hitting hardware limits