AI/ML Operations
Comprehensive overview of monitoring and operations for AI infrastructure, covering GPU monitoring tools (DCGM, BCM), infrastructure monitoring (Prometheus, Grafana), cluster orchestration (Kubernetes, Slurm), power and cooling monitoring, high availability, failure scenarios, security monitoring, GPU utilization optimization, capacity planning, multi-GPU scaling strategies, lifecycle management, logging systems, and alerting best practices.
Monitoring & Operations AI Infrastructure
AI clusters are:
- GPU-dense
- Power-hungry
- Network-intensive
- Storage-dependent
DevOPs Goals is to:
- Maximize GPU utilization
- Detect failures early
- Prevent downtime
- Optimize performance
- Ensure thermal and power stability
Observability:
Why is it happening?
- Observability includes:
- Metrics
- Logs
- Traces
Monitoring:
What is happening?
AI data centers monitor multiple layers:
1. Hardware Layer
- GPU temperature
- GPU utilization
- Power draw
- CPU usage
- Memory usage
- Disk I/O
- NIC throughput
2. Network Layer
- Latency
- Packet loss
- RDMA errors
- Congestion
- Throughput
3. Storage Layer
- IOPS
- Throughput
- Latency
- File system saturation
4. Application Layer
- Training job status
- Job queue depth
- Container health
- Pod failures (Kubernetes)
🧮 GPU Monitoring Tools
GPU Utilization Optimization
Low GPU utilization may indicate:
- Storage bottleneck
- Network congestion
- Poor job scheduling
- Insufficient batch size
- CPU bottleneck
Operations teams should investigate the root cause before adding more GPUs.
Capacity Planning
Operations teams must:
- Track GPU utilization trends
- Forecast storage growth
- Monitor network saturation
- Plan rack power expansion
Goal: Avoid resource shortages while maximizing GPU utilization.
Multi GPU Systems: Scale Up vs Scale Out
1. Scale Up/ Vertical Scaling ⬆️
Increase the number of GPUs within a single server Node
Technologies
NVLinkfor GPU-to-GPU communicationNVSwitchfor large multi-GPU systems
Best For
- Single-node training
- Large model inference
- Small to medium AI clusters
Key Challenge
- Load Balance between GPUs is critical
- Avoiding idle GPUs due to imbalance
Example: 8 × NVIDIA H100 GPUs connected through NVSwitch in a single server.
2. Scale Out/ Horizontal Scaling ➡️
Add more GPU servers to the cluster.
Technologies
InfiniBandorRoCEfor inter-node communicationGPUDirect RDMAfor GPU-to-GPU across nodes
Best for
- large clusters and distributed training
- Enterprise AI platforms
- Multi-rack GPU clusters
Key Challenge
- Network communication overhead
- Load balancing across nodes
- Load Balance across nodes is critical
Example
128 GPU nodes connected through InfiniBand.
Tools Used for GPU Monitoring
📟 1 System Management Interface (SMI)
Monitoring GPUs on a single server.
Use Case: Quick troubleshooting and health checks on individual systems.
Characteristics
- Command-line utility
- Fast diagnostics
- Real-time GPU statistics
nvidia-smi

nvidia-smi -l 1

nvidia-smi topo -m
📶 2 NVIDIA Data Center GPU Manager (DCGM)
Monitoring 10+ GPU nodes inside the operating system, at the GPU layer.
DCGM is NVIDIA's fleet-scale GPU monitoring and diagnostics agent — the nv-hostengine daemon on each node exposes utilization, temperature, power, ECC, and NVLink metrics as DCGM_FI_DEV_* field IDs, tracks XID error codes, and (via the DCGM Exporter bundled with the GPU Operator) feeds all of it into Prometheus, Grafana, alerting, and KEDA autoscaling.
Full deep dive — metric field IDs, XID error codes and diagnostic levels, the DCGM Exporter DaemonSet, PromQL queries, Prometheus alert rules, DCGM + KEDA autoscaling, and MIG monitoring: 👉 NVIDIA DCGM: GPU Health, Diagnostics, and Prometheus Metrics
📊 3 NVIDIA Base Command Manager (BCM)
Cluster-level infrastructure and workload management platform.
BCM operates an entire GPU cluster — bare-metal provisioning from a head node, Slurm/Kubernetes workload manager integration, user/group/quota management, and a cmsh CLI and REST API for scripting fleet-wide operations. While DCGM answers "how healthy is the GPU?", BCM answers "how is the entire cluster being provisioned, managed, and utilized?"
Full deep dive — head node vs compute node architecture, node provisioning and re-imaging, workload manager integration, cmsh CLI examples, and user/quota management: 👉 NVIDIA Base Command Manager: Provisioning and Operating GPU Clusters
👁️ Infrastructure Monitoring Tools
🔥 Prometheus
Prometheus is an open-source monitoring and alerting system built for collecting time-series metrics.
- It scrapes metrics from targets at regular intervals and stores them as time-series data.
- metric_name + labels + timestamp + value eg
gpu_utilization{node="node1", gpu="0"} 92%
Key Components:
1. Exporters
Exporters expose metrics.
Common ones:
- Node Exporter → CPU, memory, disk
- DCGM Exporter → GPU metrics
- Kubernetes Exporter → Pod/node stats
2. PromQL (Query Language)
Querying time-series data for insights.
Used to:
- Calculate averages
- Detect spikes
- Aggregate across nodes -Identify trends
Example:
- Average GPU utilization across cluster
- Network errors per minute
3. Alert manager
Triggers alerts when some threshold is breached.
Example alerts
- GPU temp exceeds threshold
- Node becomes unreachable
- Disk space low
- Packet drops increase
Alerts should be actionable, not noisy.
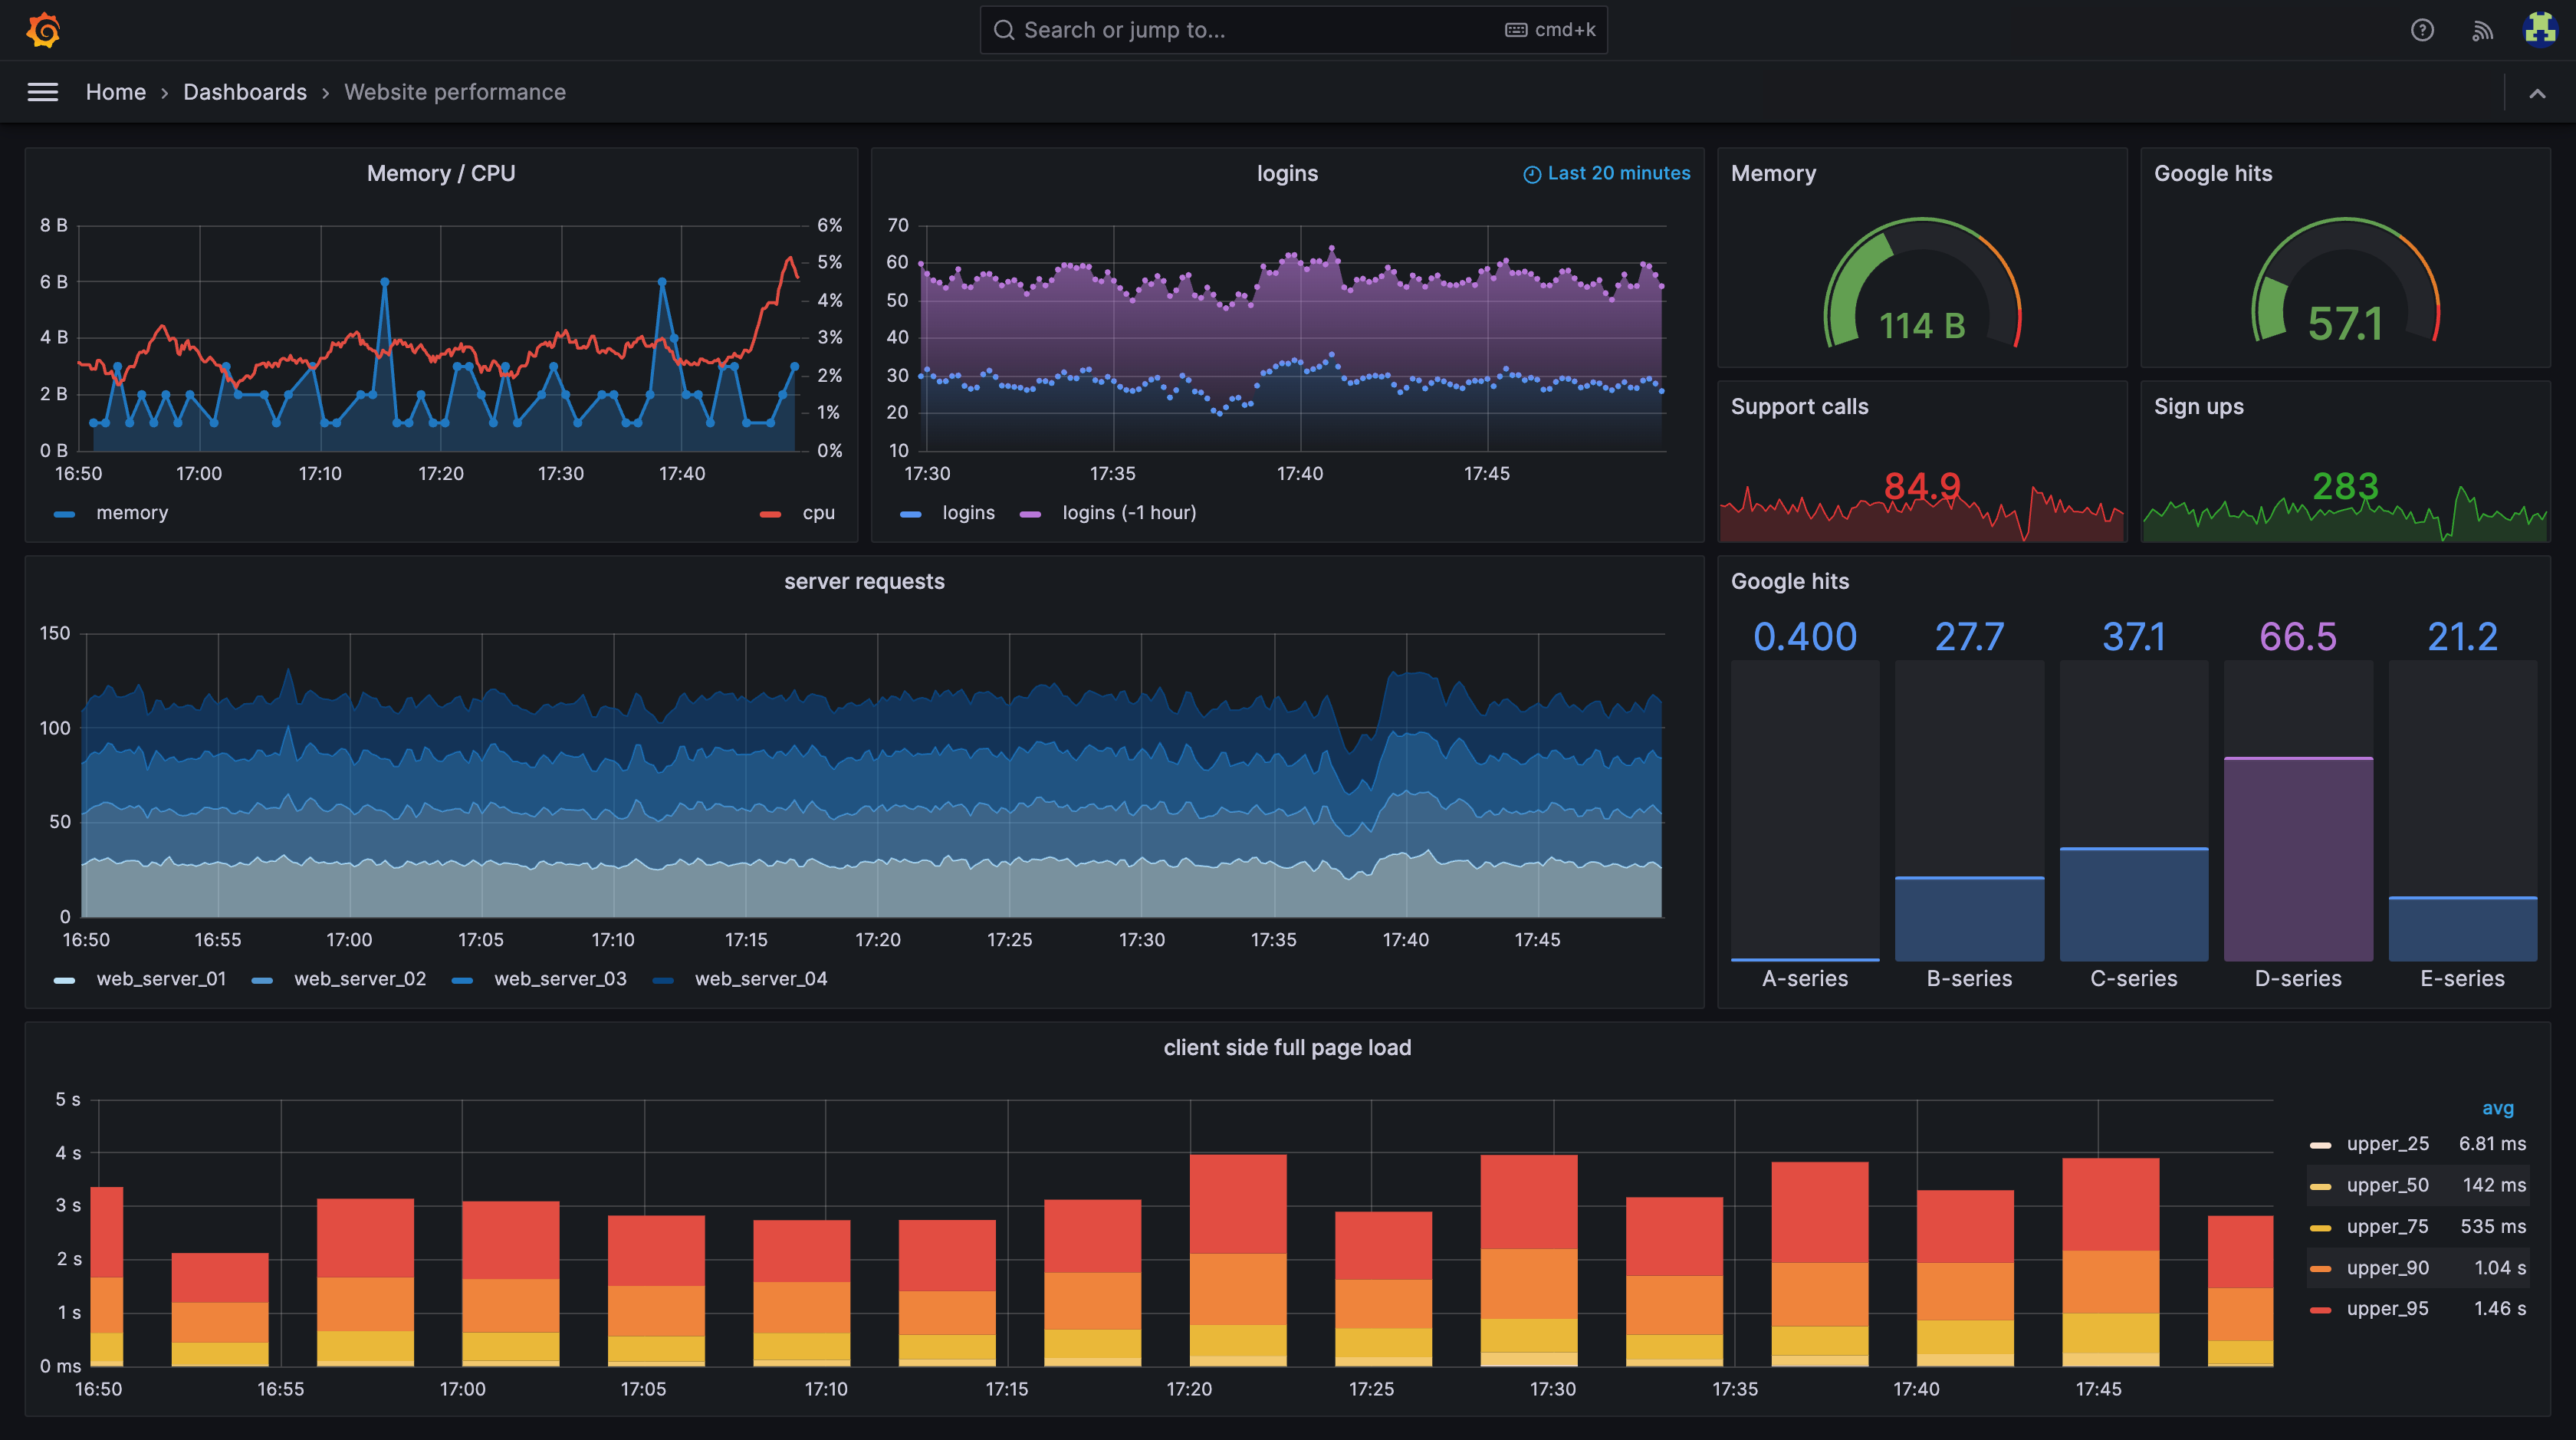
📈 Grafana
Visualize and analyze metrics collected by Prometheus and other data sources.
- Visualization dashboards
- Real-time monitoring
- Alerting integration
Prometheus vs Grafana (Common Confusion)
Prometheus = Collect & store metrics Grafana = Visualize metrics
Prometheus is the data engine. Grafana is the dashboard.
Cluster Orchestration Monitoring
1. ☸️ Kubernetes
Kubernetes for inference clusters
- Deploy → Scale → Run continuously.
Use case:
- Model serving
- AI APIs
- Microservices
- Continuous workloads
- Auto-scaling systems
Monitor:
- Pod status
- Node health
- Resource usage
- Scheduling issues
If question mentions:
- Pods
- Replica scaling
- Microservices
- Model serving endpoint
- YAML deployment
🎛️ Simple Linux Utility for Resource Mngt(Slurm)
Open-source workload manager and job scheduler for HPC and AI training clusters.
Slurm is not a Kubernetes scheduler — it's the de facto batch scheduler for supercomputers and dedicated AI training clusters, running jobs to completion (sbatch, srun, squeue) rather than as always-on services. GPU allocation, multi-node MPI jobs, and fair-share queueing across thousands of users are all native to it.
Full deep dive — controller/node-daemon architecture, GRES GPU allocation, multi-node MPI jobs, running containers under Slurm with enroot/pyxis, partitions/QOS/fair-share/backfill, and a real DGX training job script: 👉 Slurm: The HPC Workload Manager Behind AI Training Clusters
⚡️ Power & Cooling Monitoring
AI clusters consume massive power.
Monitor:
- Rack power draw
- PSU health
- Cooling system efficiency
- Data center temperature
- Airflow
Failure to monitor → thermal shutdown.
Power Usage Effectiveness (PUE)
standard metric for measuring data center energy efficiency, calculated as the ratio of total facility power to IT equipment power
Lower PUE means better energy efficiency.
That mean PUE is always
The higher the number, the more energy is used for overhead (cooling, power losses, etc.).
100% of energy supports computing
- Impossible in real world
Highly efficient
- Close to ideal eg AWS/Google data centers
Inefficient Data Center
For every 1 watt used by IT, another 1 watt is used for infrastructure.
- Typical older data centers have PUEs between 1.5 and 2.0
Cooling Options
1. Air Colling
- Max at
30 kW per rack - Less efficient at high densities
- Lower infrastructure cost
2. Liquid Cooling
- Better for high density racks (
30–80 kW+) - More efficient heat removal
- Expensive infrastructure
High Availability (HA)
AI infrastructure should support:
- Redundant power supplies
- Redundant networking paths
- Failover nodes
- Backup storage
Single point of failure = unacceptable.
Failure Scenarios to Understand
Common failures:
- GPU overheating
- Node crash
- Network congestion
- Storage saturation
- Job scheduler deadlock
Monitoring enables:
- Rapid detection
- Root cause analysis
- Faster recovery
Security Monitoring
Includes:
- Unauthorized access attempts
- Configuration changes
- Network anomalies
- DPU isolation policies
- Role-based access control
Exam Scenarios to Recognize
If question mentions:
- GPU temperature spikes → Thermal monitoring
- ECC memory errors → DCGM
- Dashboard visualization → Grafana
- Metric scraping → Prometheus
- HPC job queue management → Slurm
- Container orchestration → Kubernetes
- Rack power issue → Data center monitoring
- Underutilized GPUs → Operational inefficiency
Lifecycle Management
Operations includes:
- Firmware updates
- Driver updates
- CUDA updates
- Security patches
- Hardware replacement
Change management must:
- Minimize downtime
- Be documented
- Be tested
Logging Systems
Logs provide:
- Error tracing
- Job debugging
- Security auditing
- System failure analysis
Centralized logging:
- Aggregated logs
- Searchable
- Long-term retention
Alerting Strategy
Monitoring without alerting = useless.
Effective alerts:
- Temperature threshold exceeded
- GPU ECC errors
- Node unreachable
- Disk nearly full
- Network congestion
Alerts should be:
- Actionable
- Prioritized
- Not noisy
Quick Memory Anchors
- DCGM = GPU health monitoring
- Prometheus = Metrics collection
- Grafana = Visualization
- Slurm = HPC job scheduler
- Kubernetes = Container orchestration
- Monitoring prevents GPU idle time
- Alerting must be actionable
Related Posts
- GPU Scheduling on Kubernetes — how the GPU Operator (which bundles DCGM) is deployed, and how
nvidia.com/gpuresources are advertised to the scheduler - GPU Autoscaling: KEDA, HPA, and Cluster Autoscaler — KEDA consuming DCGM metrics from Prometheus to drive autoscaling decisions
- Kubernetes Observability — cluster-level observability (kube-state-metrics, node-exporter) that complements GPU-level DCGM metrics
- HPC at Scale on Kubernetes — multi-node training where DCGM health checks are critical before launching distributed jobs
- NCCL: GPU Communication — NVLink bandwidth metrics (DCGM_FI_DEV_NVLINK_BANDWIDTH_TOTAL) tell you whether NCCL all-reduce is hitting hardware limits
- NVIDIA DCGM — the GPU-level metrics source feeding most AI Ops dashboards